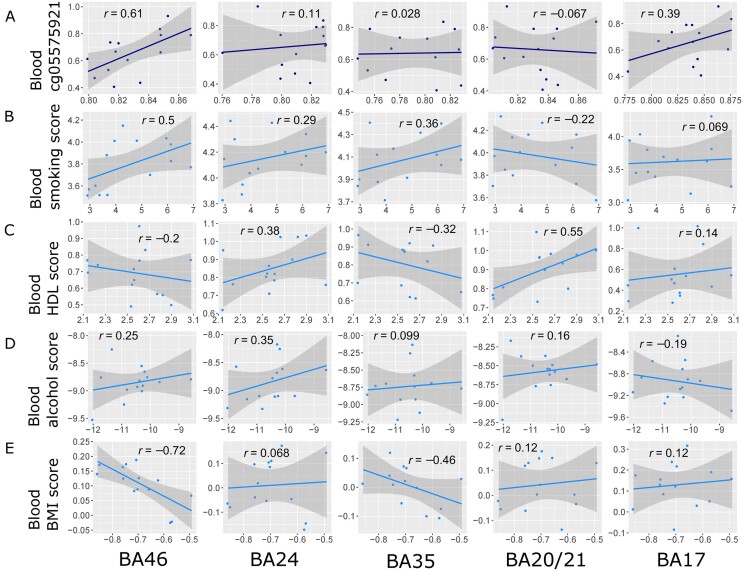
Figure 2.
Correlations for (A) site cg05575921 (dark blue) and blood-derived lifestyle trait predictor scores for (B) smoking, (C) HDL, (D) alcohol and (E) BMI traits applied to the blood and brain (light blue). Relationships between brain DNAm and blood DNAm are shown for each brain region and measure. Each point represents one individual. Pearson correlation coefficients are annotated in each case. All individuals had both blood and brain samples available (n = 14), apart from one individual for which no BA35 hippocampal sample was available (n = 13). The solid blue line represents the linear regression slope; shaded areas represent 95% confidence intervals.

