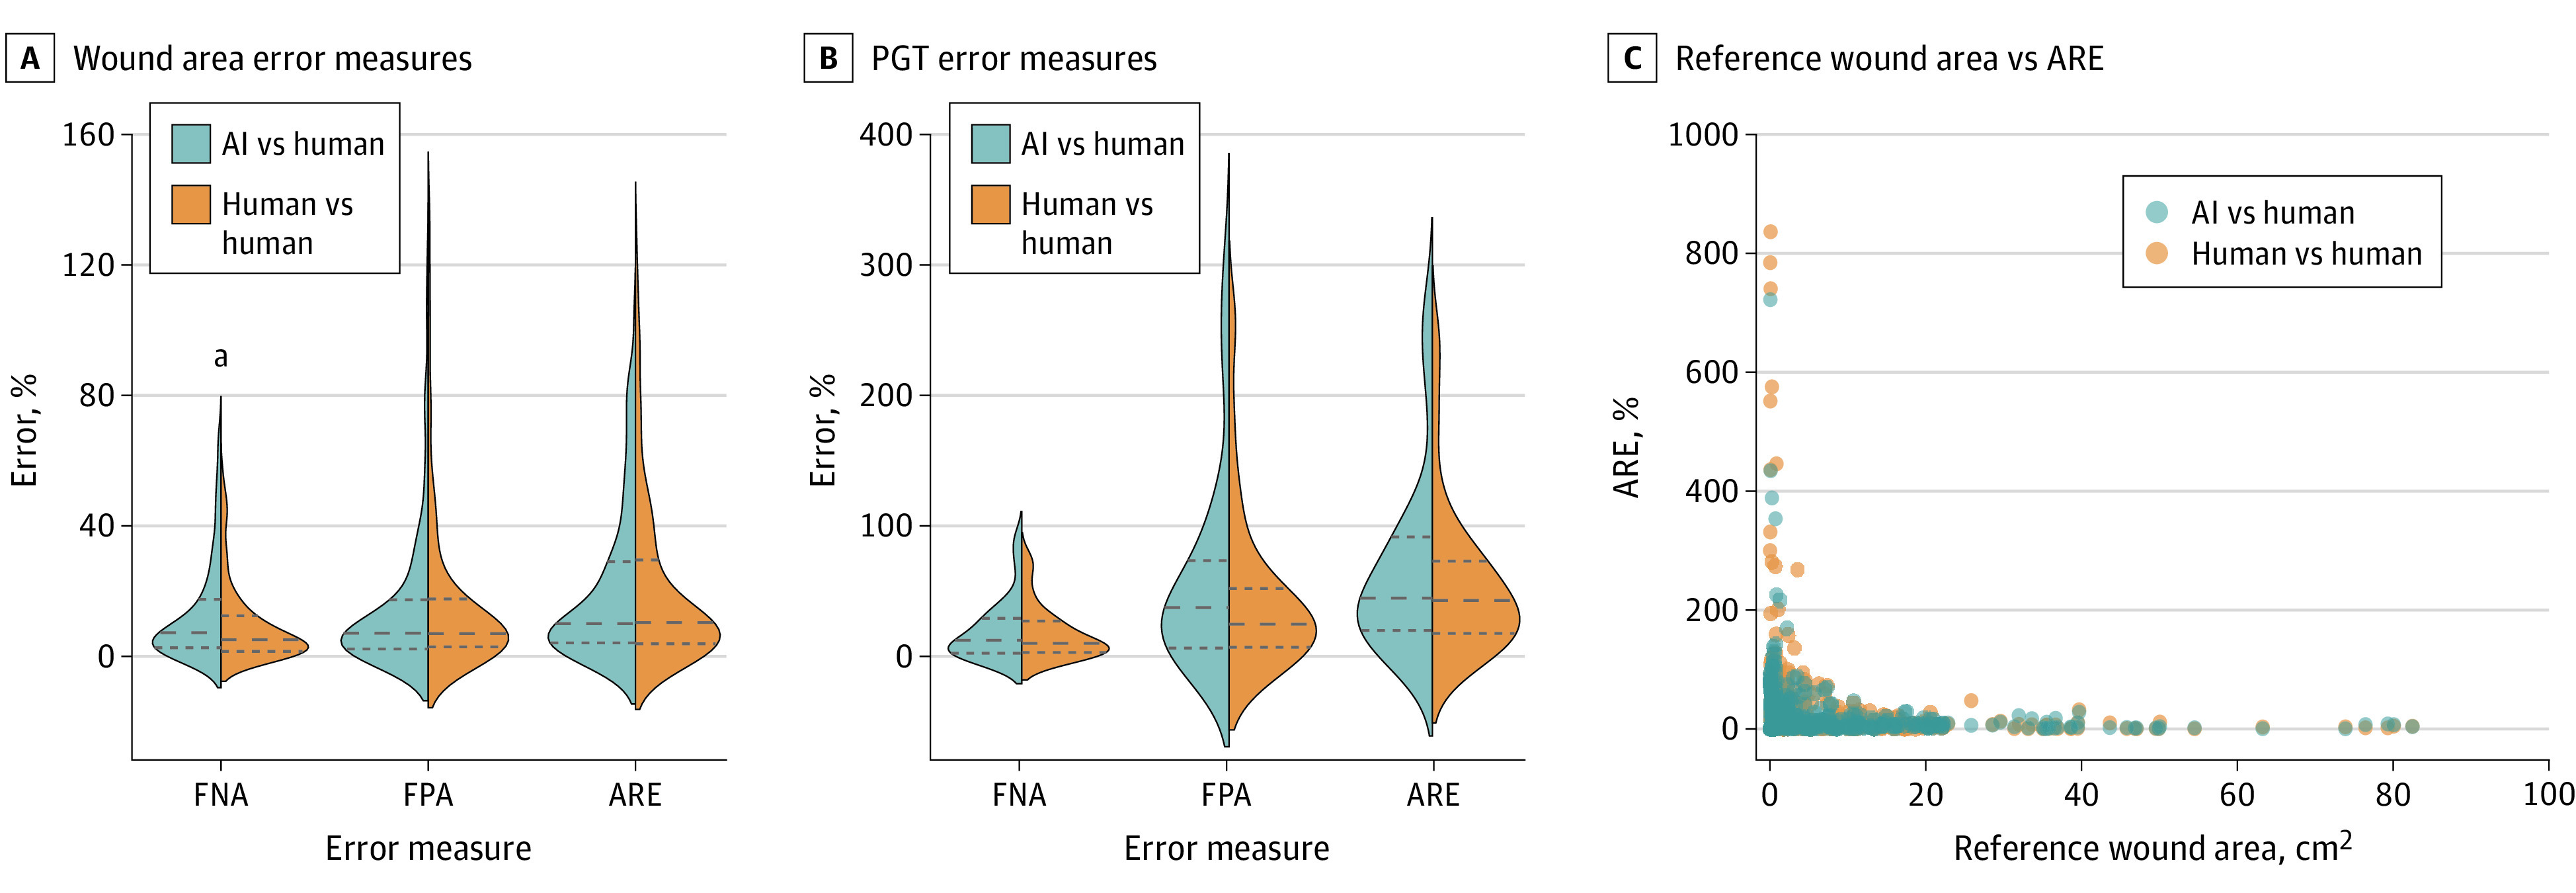
Figure 2. Quantitative Evaluation of Human and Artificial Intelligence (AI) Wound Area and Percent Granulation Tissue (PGT) Measurements.

A and B, Violin plots showing distributions of wound area (A) and PGT (B) error measures of false-negative area (FNA), false-positive area (FPA), and absolute relative error (ARE) for AI vs human and human vs human comparisons. Dashed lines indicate the median and quartiles of the error measure distributions. Outliers above the 98th percentile are not shown to aid visualization of the distributions but were included in the statistical analysis. C, Scatter plot showing ARE vs the reference wound area for AI vs human and human vs human comparisons.
aP < .05.
