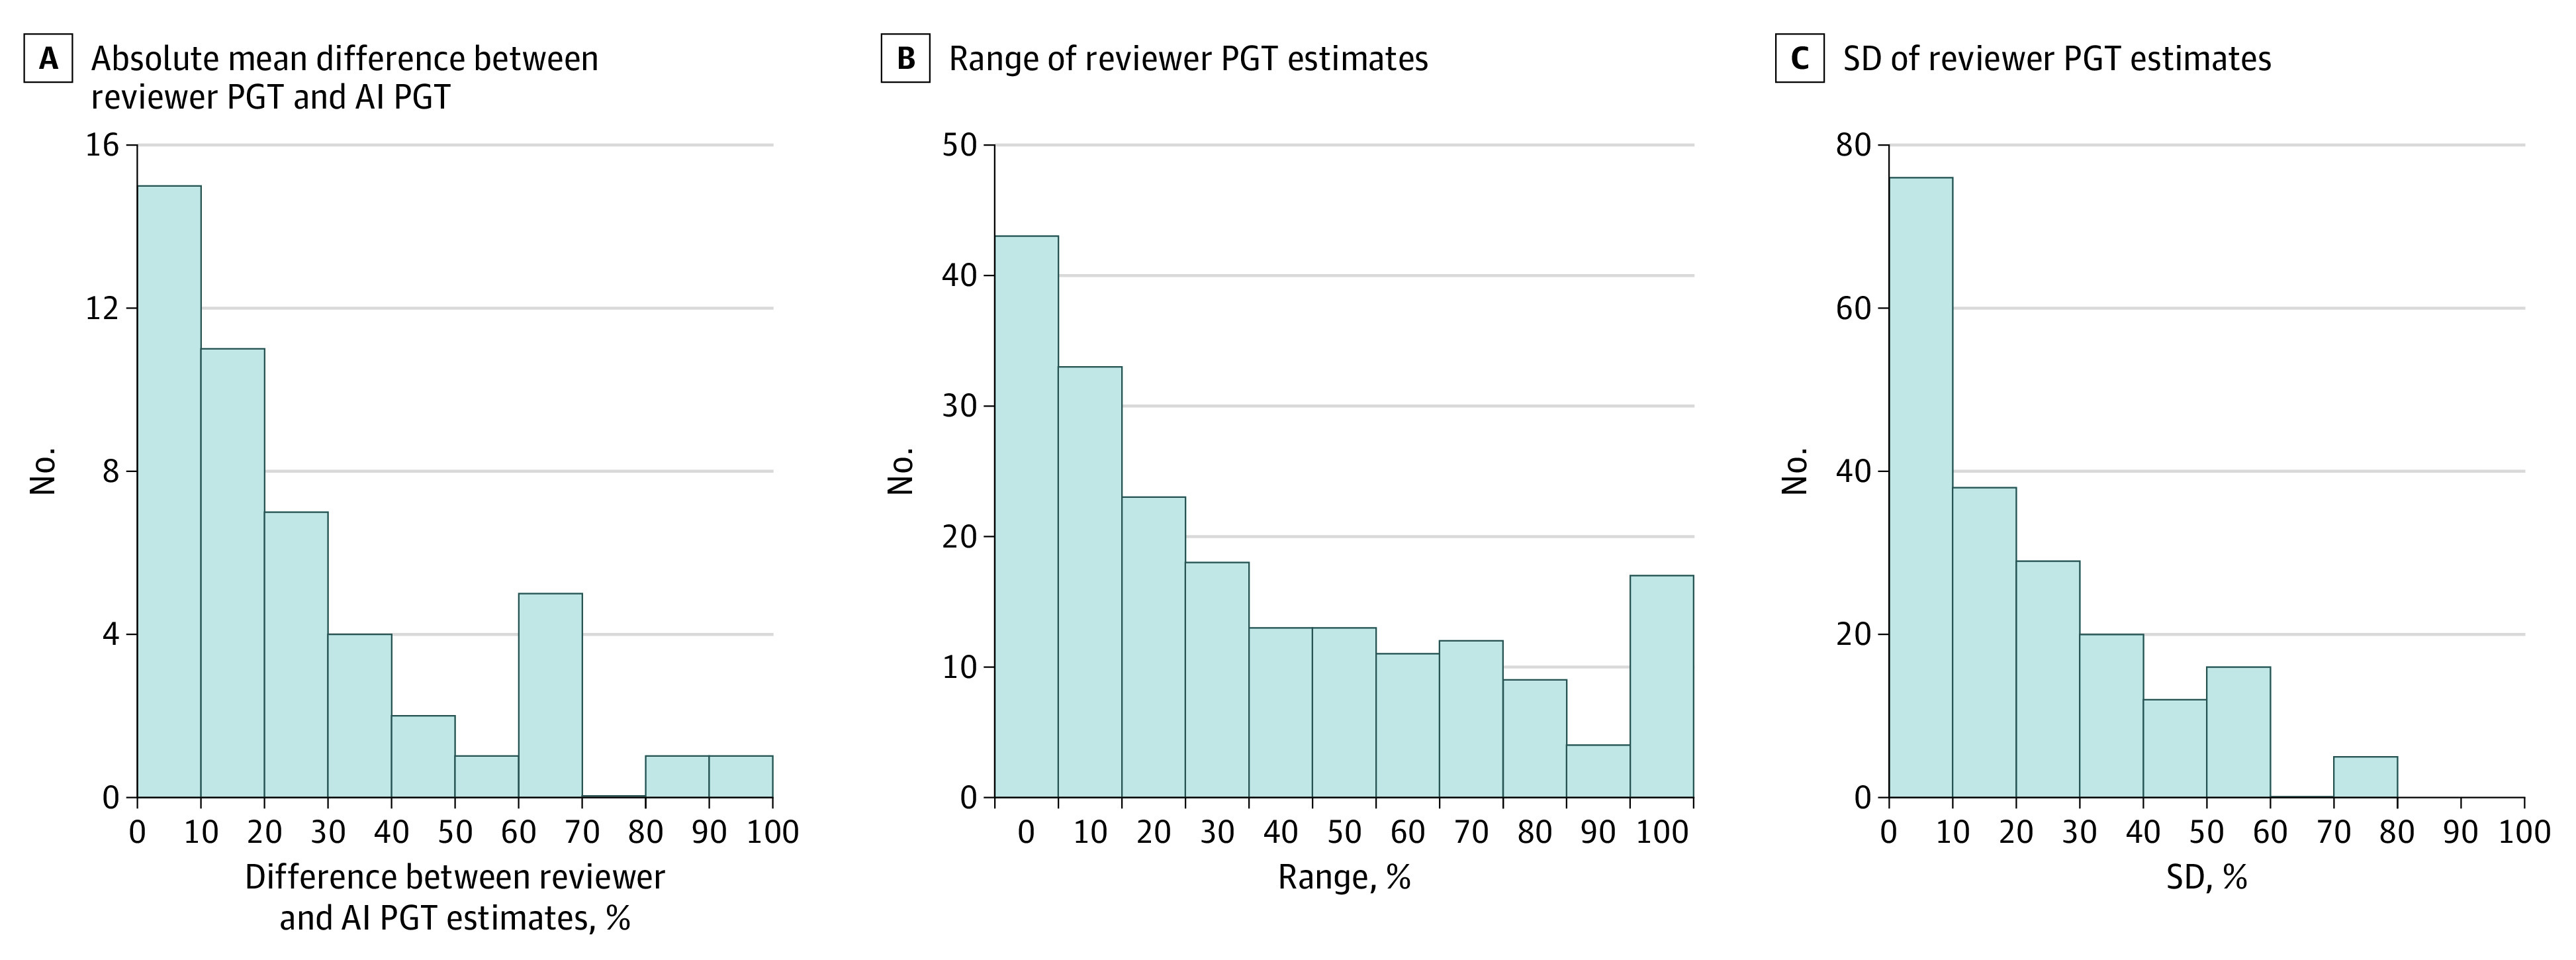
Figure 3. Quantitative Evaluation of Blinded Reviewer and Artificial Intelligence (AI) Percent Granulation Tissue (PGT) Assessments.

A, Histogram of absolute difference between the mean of the 3 reviewers’ visual PGT estimates and the AI PGT measurement for the subset of photographs with AI granulation tissue tracings at each site. B-C, Histograms of variability measures (range and SD) of the 3 reviewers’ visual PGT estimates for all photographs at each site.
