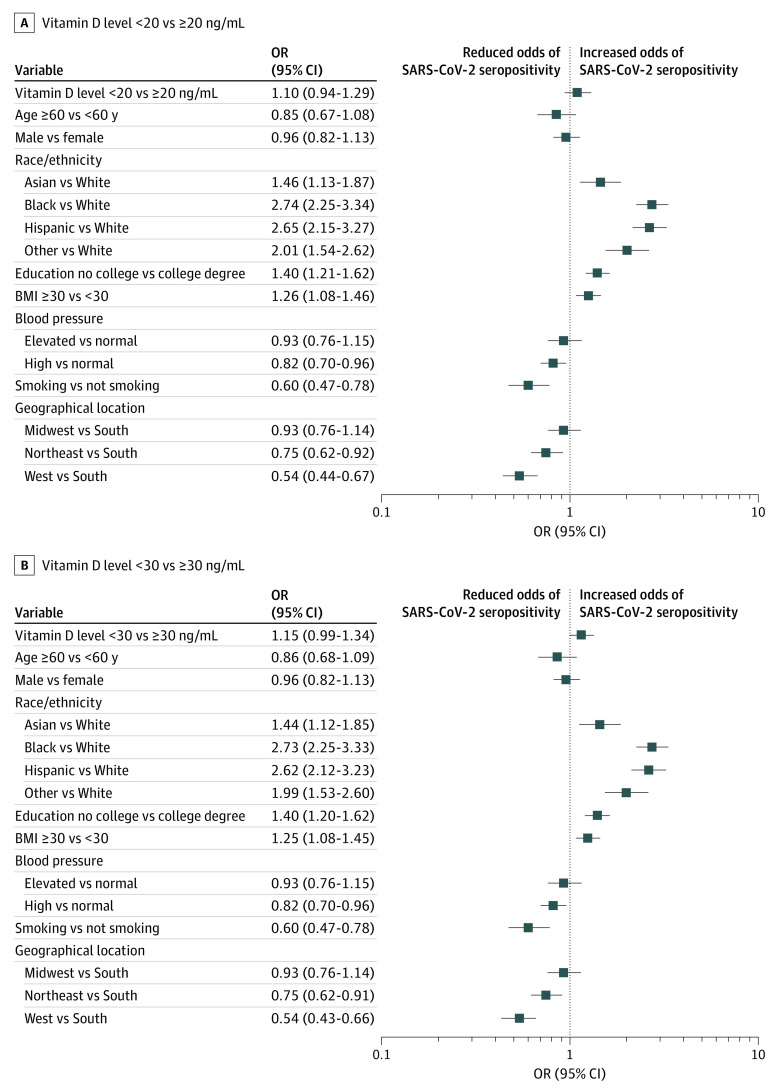
Figure 2. Odds Ratios (ORs) of SARS-CoV-2 Seropositivity.
A, Vitamin D level less than 20 vs greater than or equal to 20 ng/mL. B, Vitamin D level less than 30 vs greater than or equal to 30 ng/mL. Association of SARS-CoV-2 seropositivity with each variable was adjusted for all other variables shown (covariates were treated categorically). The analysis was based on the 2019 data for vitamin D levels, body mass index (BMI; calculated as weight in kilograms divided by height in meters squared), blood pressure, and smoking status. Other race/ethnicity included American Indian or Alaska Native, Native Hawaiian or other Pacific Islander, or 2 or more races or ethnicities.

