
FIGURE 1.
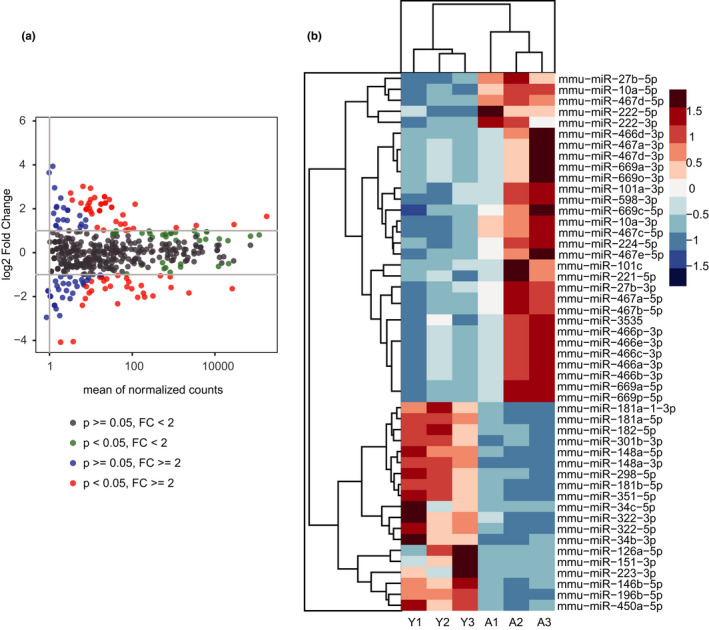
Differentially expressed miRNAs in CD27+ NK cells from young and aged mice. (a) The MA plot of differentially expressed miRNAs in CD27+ NK cells from young mice and aged mice. Each dot represents a differentially expressed miRNA in aged mice. The log2 fold change of each miRNA was calculated by the mean of normalized counts. P: p‐value; FC: fold change. (b) The heatmap of differentially expressed miRNAs profiled in CD27+ NK cells from the young mice (Y1–Y3 represent three individual repeats), and the aged mice (A1–A3 represent three individual repeats). The color scale shown on the left illustrates the relative expression levels of the miRNAs. The upregulated miRNAs are depicted in red color whereas the downregulated miRNAs are depicted in blue color