
FIGURE 2.
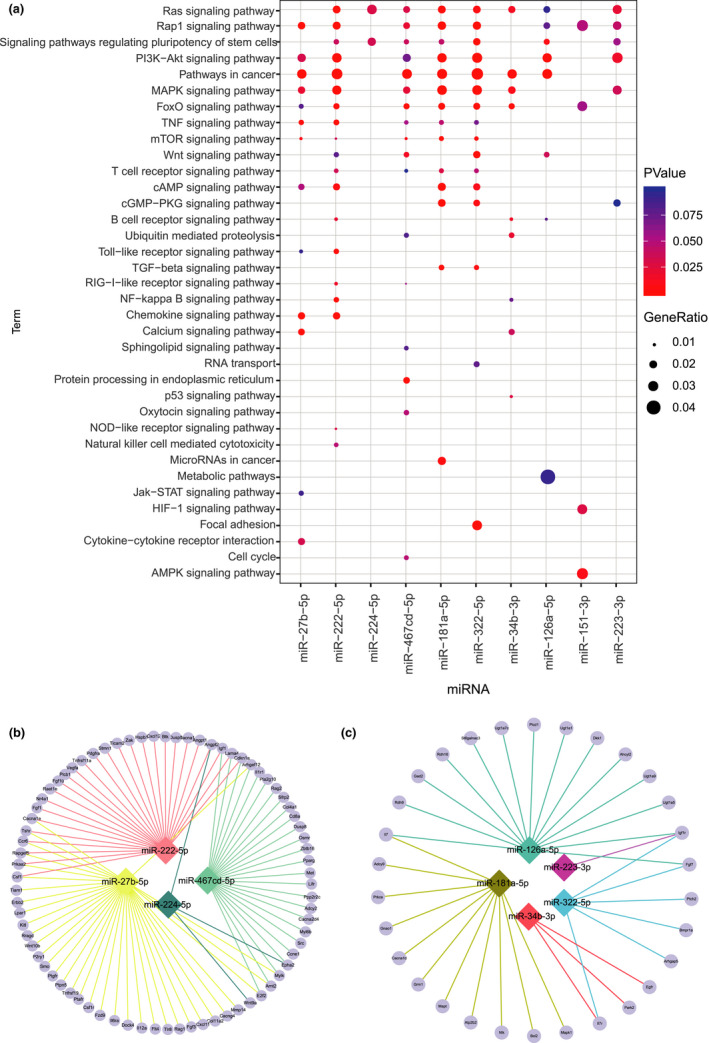
Potential targets and function analysis of the 10 candidate miRNAs. (a) The function of miRNA was analyzed based on the target gene information by KEGG pathway enrichment analysis. The abscissa represents miRNA, and the ordinate represents enriched function. Nodes represent enrichment extent. (b) Interactive network diagram of the four upregulated miRNAs in CD27+ NK cells from aged mice and their downregulated potential target genes. (c) Interactive network diagram of the five downregulated miRNAs in CD27+ NK from aged mice and their upregulated potential target genes. Rhombic dots represent the differentially expressed miRNAs. Round dots represent the differentially expressed target genes