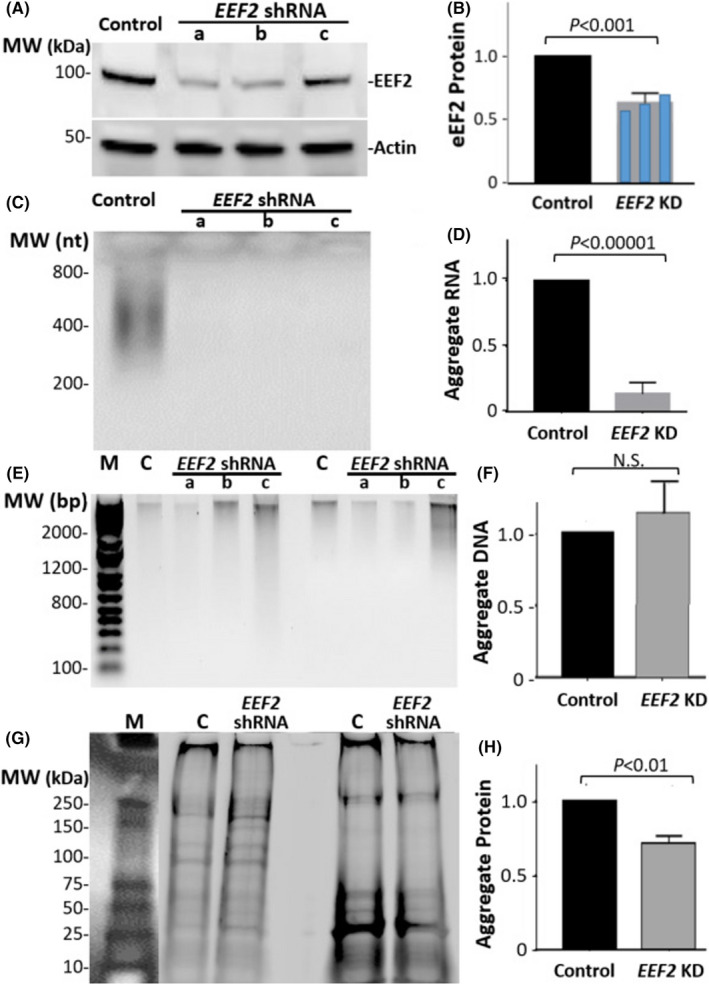
FIGURE 3.

Effects of EEF2 knockdown on the composition of aggregates in SY5Y‐APPSw cells. Results shown in each panel comprise data from 3 independent cell expansions treated with shRNA constructs targeting EEF2, or 2 scrambled RNAs for controls. Replicate experiments produced similar results. (A, B), Western‐blot quantitation of EEF2 knockdown efficacy, evaluated by EEF2 protein; efficacies of individual shRNAs (constructs a, b, c in Methods) are superimposed in B. (C, D), total RNA fragments in aggregates, quantified by gel staining with SYBR Gold. (E, F) Total DNA fragments in aggregates, quantified by ethidium bromide fluorescence. (G, H) Total aggregate protein, quantified by staining with SYPRO Ruby. p values shown here are based on 2‐tailed heteroscedastic t tests, for 3 – 4 experiments, combining data from shRNAs a – c
