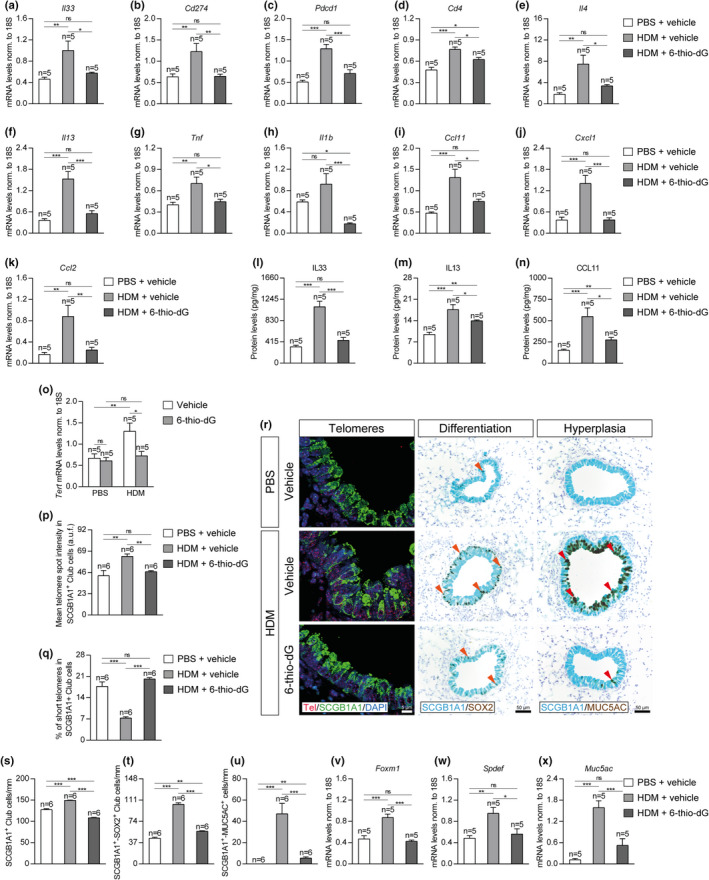
FIGURE 7.

Telomere dysfunction diminishes the expression of allergic markers, prevents telomere elongation and differentiation in Club cells, and attenuates goblet cell hyperplasia after HDM‐induced allergy. (a–k) Lung tissue mRNA expression levels of Il33 (dendritic cell activation) (a), Cd274 (PD‐L1) (b) and Pdcd1 (PD‐1) (c) (Immune checkpoint, T‐cell activation), Cd4 (T‐cell marker) (d), Il4 (e) and Il13 (f) (Th2 cytokines), Tnf (g) and Il1b (h) (Th1 cytokines), Ccl11 (eosinophil chemotaxis) (i), Cxcl1 (neutrophil chemotaxis) (j), and Ccl2 (macrophage chemotaxis) (k) in HDM‐challenged mice treated with 6‐thio‐dG versus controls. (l‐n) IL33, IL13, and CCL11 protein levels in lung homogenates from HDM‐challenged mice treated with 6‐thio‐dG vs. controls. Lung tissue mRNA expression levels of Tert normalized to 18S expression in PBS‐ and HDM‐challenged mice treated with vehicle or 6‐thio‐dG (o). (p‐q) Quantification of mean telomere fluorescence (mean telomere spot intensity) (p) and percentage of short telomeres (q) in Club cells corresponding to the 20th percentil of the fluorescence intensity values of controls (PBS‐challenged mice treated with the vehicle) in HDM‐challenged mice treated with 6‐thio‐dG versus controls. (r) Representative images of proximal airways showing a Q‐FISH for telomere spot fluorescence in Club cells (Cy3Tel probe (red), SCGB1A1+ cells (green) and nuclei stained with DAPI (blue)) (left) and representative immunostainings for SCGB1A1 (blue) and SOX2 (brown; orange arrowheads indicate double SCGB1A1+‐SOX2+ Club cells) (center) and SCGB1A1 (blue) and MUC5AC (brown; red arrowheads indicate double SCGB1A1+‐MUC5AC+ cells) (right) in lung sections from HDM‐challenged mice treated with 6‐thio‐dG versus controls. (s‐x) Quantification of SCGB1A1+ (s) or double SCGB1A1+‐SOX2+ Club cells (t) and SCGB1A1+‐MUC5AC+ cells (u) per epithelium length and total lung mRNA expression levels of the goblet cell hyperplasia markers Foxm1 (v), Spdef (w) and Muc5ac (x) normalized to 18S expression in HDM‐challenged mice treated with 6‐thio‐dG versus controls. Quantifications in lung sections were performed in 4 different bronchi in a random way. Data are expressed as mean ±SEM. *p < 0.05; **p < 0.01; ***p < 0.001 (Dunn–Sidak multiple comparison test). The number of mice is indicated in each case
