FIGURE 2.

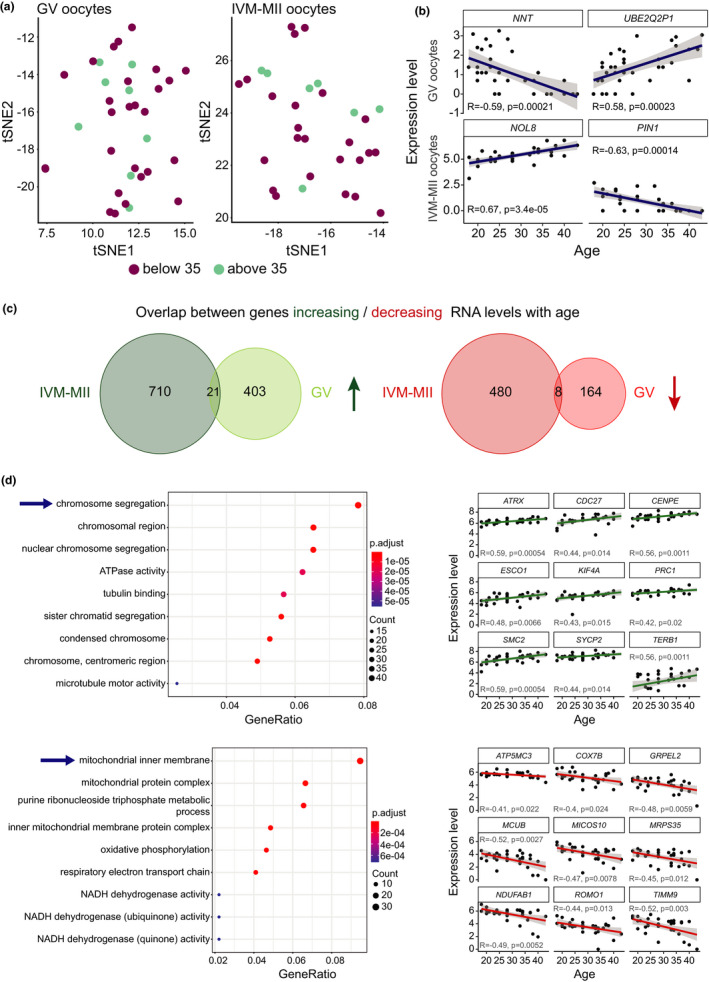
Analysis of gene expression correlation with age. (a) Cluster analysis of oocytes at each maturation stage, GV and IVM‐MII, independently. (b) Examples of genes that correlate with age. NNT and UBE2Q2P1 are genes found in the GV set of oocytes, while NOL8 and PIN1 were identified within the IVM‐MII oocyte population. (c) Venn diagrams showing the overlap between genes changing RNA levels with age in GV and IVM‐MII oocytes. In green, genes whose RNAs abundance increased with age, in red the number of genes whose RNAs abundance decreased with age. (d) Gene ontology analysis of genes that change with age in IVM‐MII oocytes (left) and examples of how expression levels of genes in some of the most significant GO terms (indicated by arrows) vary with age (right). Upper panel: genes belonging to the GO term ‘chromosome segregation’ for which expression increases with age. Lower panel: genes belonging to the GO term ‘mitochondrial inner membrane’ for which expression decreases with age
