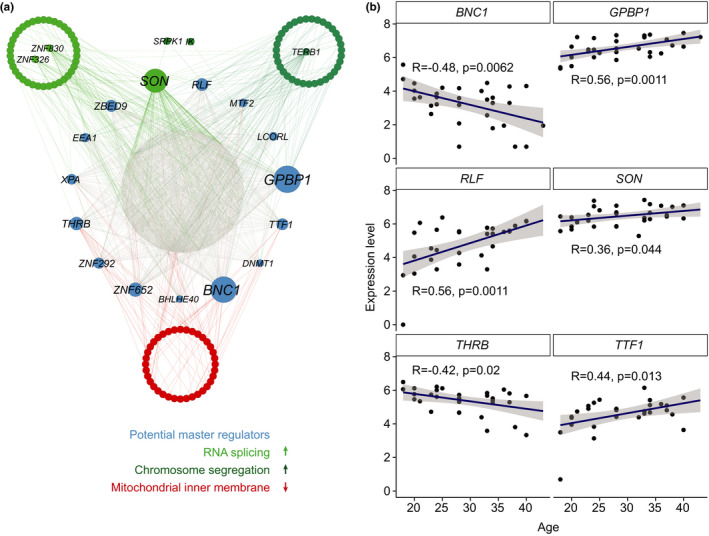
FIGURE 3.

Gene regulatory network analysis. (a) Cytoscape plots from the top 2500 regulatory links among genes found to correlate with age in IVM‐MII oocytes. A list of known human transcription factors was given as an input to Genie3 to be used as potential regulators of the network. In green are genes belonging to two of the GO terms enriched in genes whose RNA levels increase with age, ‘RNA splicing’ (light green) and ‘chromosome segregation’ (dark green). SRPK1 and IK belong to both of these GO terms, and therefore they are plotted in between. In red are genes for which RNA levels decrease with age belonging to the enriched GO term ‘mitochondrial inner membrane’. (b) Expression dynamics of the potential master regulators of genes that correlate with age in IVM‐MII oocytes
