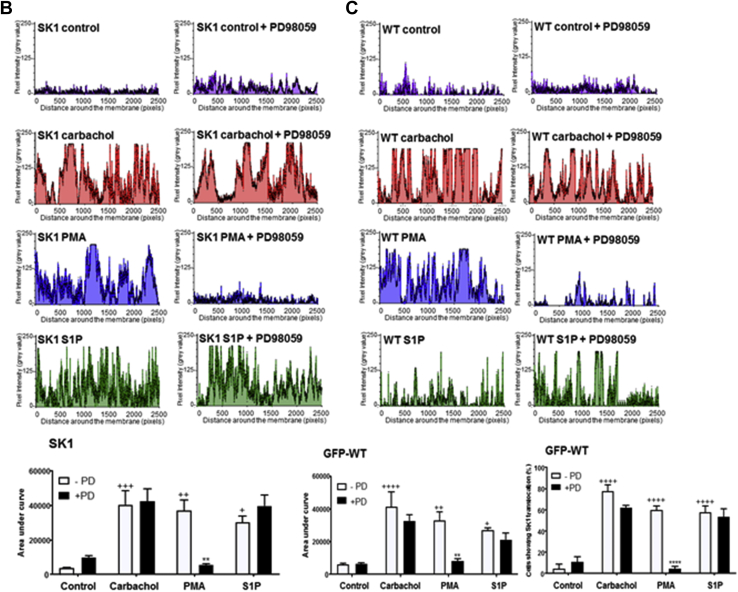
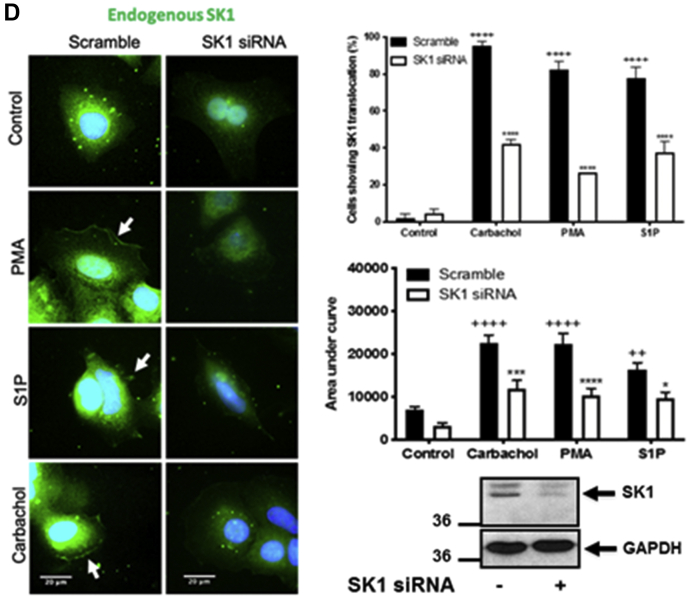
Figure 1.
Effect of the MEK-1 inhibitor, PD98059, on the translocation of endogenous SK1 and WT GFP-mSK1 in MCF-7L cells. MCF-7L cells expressing endogenous SK1 and WT GFP-mSK1 were pretreated with and without PD98059 (50 μM, 1 h) or SK1 siRNA (200 nM, 24 h) before S1P (5 μM) or PMA (1 μM,) or carbachol (100 μM) for 10 min. Cells were processed (see Experimental procedures) and mounted with DAPI to stain the DNA (blue). A, photomicrographs of cells of 40× oil magnification expressing endogenous SK1 or WT GFP-mSK1 (detected with an anti-SK1 antibody and FITC-conjugated secondary antibody or by GFP immunofluorescence, respectively). Inset is a Western blot probed with the anti-GFP antibody or P-ERK antibodies showing the overexpression of WT GFP-mSK1 and inhibition of ERK-1/2 phosphorylation by PD98059. Reprobing with total ERK-1/2 or GAPDH is used to confirm similar protein loading. Representative results of three independent experiments. B and C, membrane intensity measurements were made from five individual MCF-7L cells and stitched together (see Experimental procedures) (n = 5) for endogenous SK1 (B) and WT GFP-mSK1 (C). B, the bar graph represents the AUC of the total level of endogenous SK1 translocation (n = 5); ∗∗p < 0.01 PMA alone versus PMA with PD98059; +p < 0.05, ++p < 0.01, and +++p < 0.001 for stimulus versus control for endogenous SK1 (two-way ANOVA with Tukey's post hoc test). C, the left bar graph represents the AUC of transfected WT GFP-mSK1 translocation (n = 5). The right bar graph represents the percentage of cells containing translocated WT GFP-mSK1 (n = 3); ∗∗p < 0.01, ∗∗∗∗p < 0.0001 PMA alone versus PMA with PD98059; +p < 0.05, ++p < 0.01, and ++++p < 0.0001 for stimulus versus control transfected WT GFP-mSK1 (two-way ANOVA with Tukey's post hoc test). D, photomicrographs of cells of 40× oil magnification showing the effect of SK1 siRNA on endogenous SK1 expression. The upperbar graph represents the percentage of cells (n = 3) containing translocated endogenous SK1. ++++p < 0.0001 for control scrambled versus stimulated scrambled and ∗∗∗p < 0.001 for SK1 siRNA versus scrambled (two-way ANOVA with Tukey's post hoc test). The lowerbar graph represents the AUC of the total level of endogenous SK1 translocation (n = 5). ++p < 0.01 and ++++p < 0.0001 for control scrambled versus stimulated scrambled, ∗p < 0.05, ∗∗∗p < 0.001, and ∗∗∗∗p < 0.0001 for SK1 siRNA versus scrambled (two-way ANOVA with Tukey's post hoc test). AUC, area under the curve; ERK, extracellular signal–regulated kinase; mSK1, mouse SK1; PMA, phorbol 12-myristate 13-acetate; SK1, sphingosine kinase 1.


