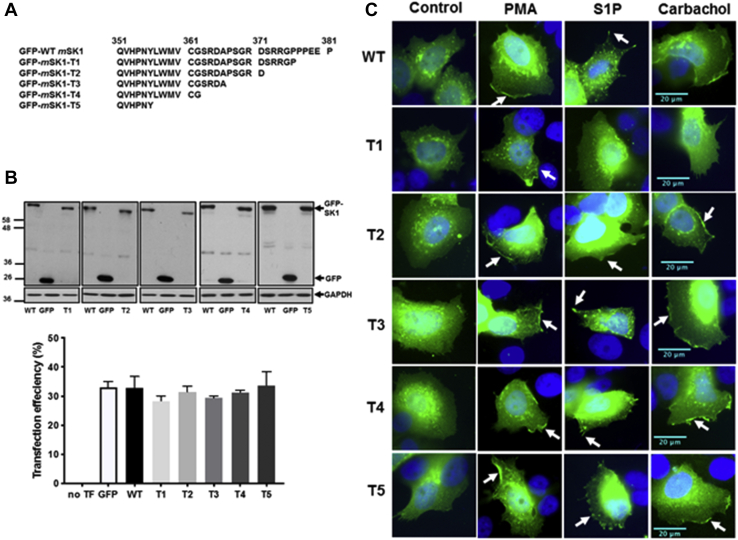
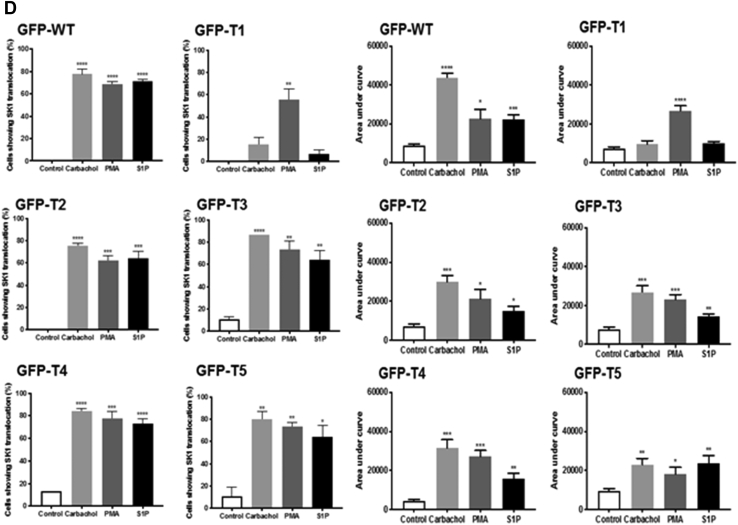
Figure 9.
Characterization of C-terminal tail (T1-T5) mutants. MCF-7L cells separately overexpressing WT-GFP-mSK1 or each of the T1-T5 mutants were treated with S1P (5 μM) or PMA (1 μM) or carbachol (100 μM) for 10 min. Cells were processed and mounted with DAPI to stain the DNA (blue). A, schematic to show the C-terminal amino acid sequence of the T1-T5 mSK1 mutants. B, Western blot probed with the anti-GFP antibody showing the overexpression of WT and T1-T5 GFP-mSK1; the bar graph shows transfection efficiency. Reprobing with GAPDH is used to confirm similar protein loading. No significant difference between WT versus mutants (one-way ANOVA with Tukey's post hoc test). C, photomicrographs of GFP fluorescence in cells of 40× oil magnification separately overexpressing WT GFP-mSK1 or each of T1-T5 GFP-mSK1 mutants. Results are representative of three independent experiments. D, the bar graphs represent the AUC of transfected GFP-mSK1 (WT or T1-T5) translocation (n = 5) and the percentage of cells containing translocated GFP-mSK1 (WT or T1-T5) at the PM in response to stimulus (n = 3); ∗p < 0.05, ∗∗p < 0.01, ∗∗∗p < 0.001, and ∗∗∗∗p < 0.0001 for AUC for stimulus versus control for each of WT or T1-T5 (unpaired t test). AUC, area under the curve; mSK1, mouse SK1; PM, plasma membrane; PMA, phorbol 12-myristate 13-acetate; S1P, sphingosine-1-phosphate.


