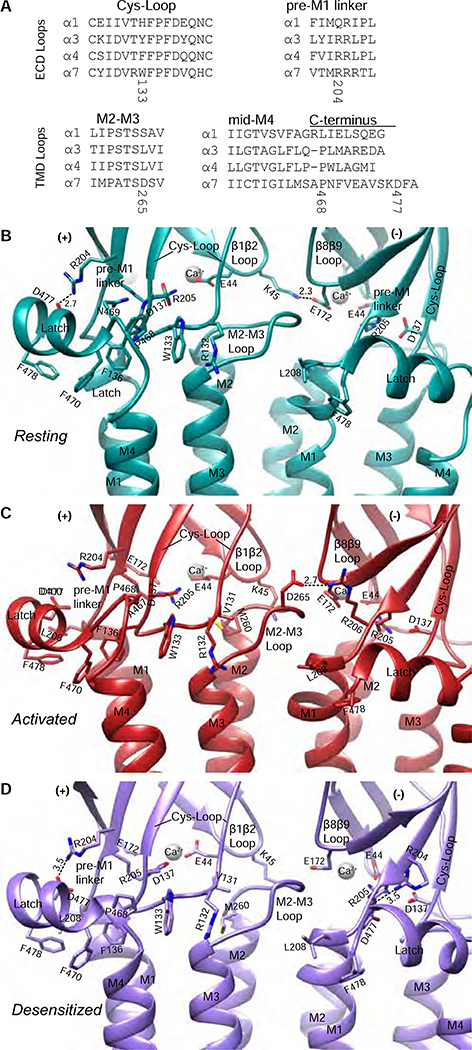
Figure 3: Coupling region interactions and conformational differences.
A, Alignments of amino acids from α subunits in the nicotinic receptor family for coupling regions. B-D, The coupling region in resting (B), activated (C), and desensitized (D) conformations. Dashed lines indicate electrostatic interactions with distances in Angstrom (Å).

