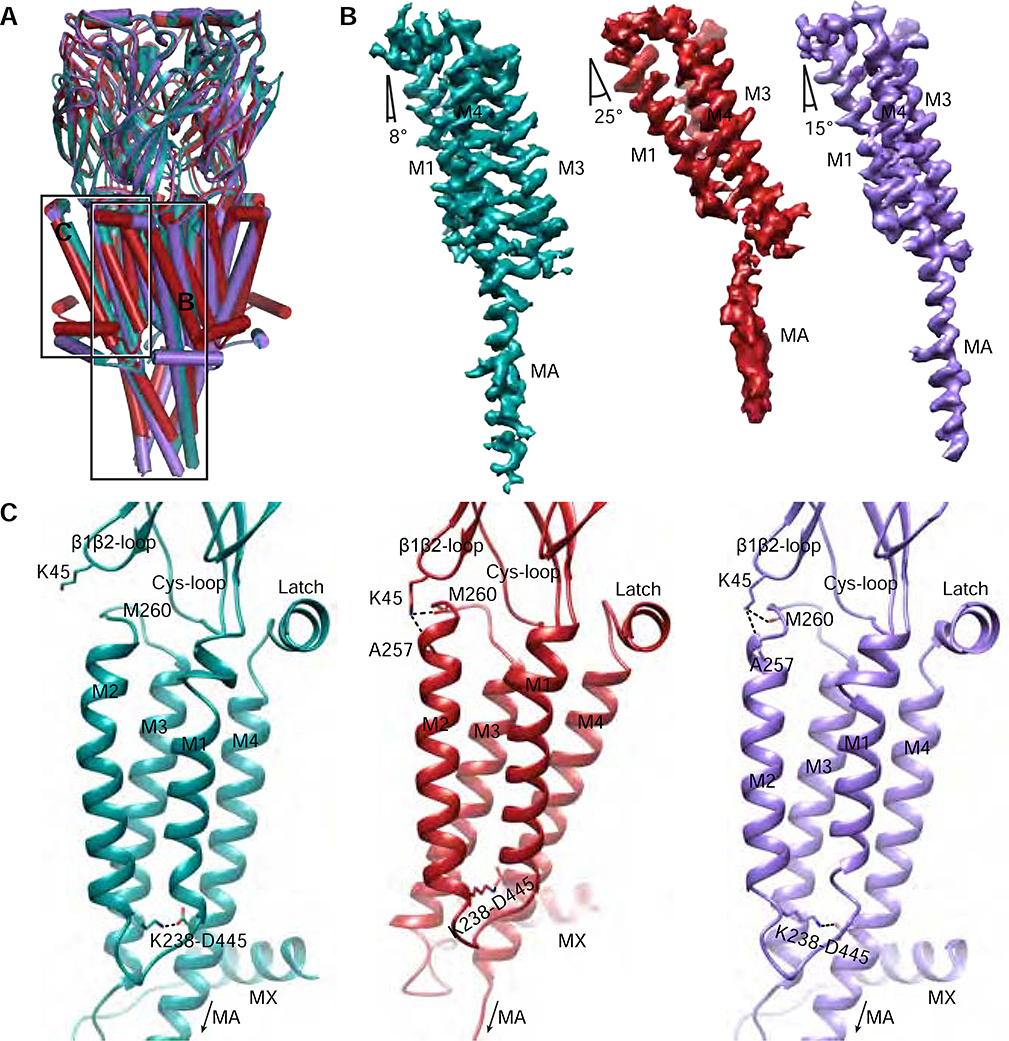
Figure 4: Conformational transitions in α7 transmembrane and intracellular domains.
A, Global superposition of the three α7 structures. α-Helices are represented as cylinders. Teal, resting. Red, activated. Purple, Desensitized. Boxed areas indicate regions in panels B-C. B, Experimental density maps aligned by their ECD showing tilting of M1, M3 and M4 helices from a single subunit from each structure. The Mx density has been removed for clarity. C, the TMD helix bundle as viewed from the pore. The M2-M4 salt bridge between K238 and D445 is indicated. K45 capping of the M2 helix (dashed lines) is shown in the activated (red) and desensitized (purple) states.

