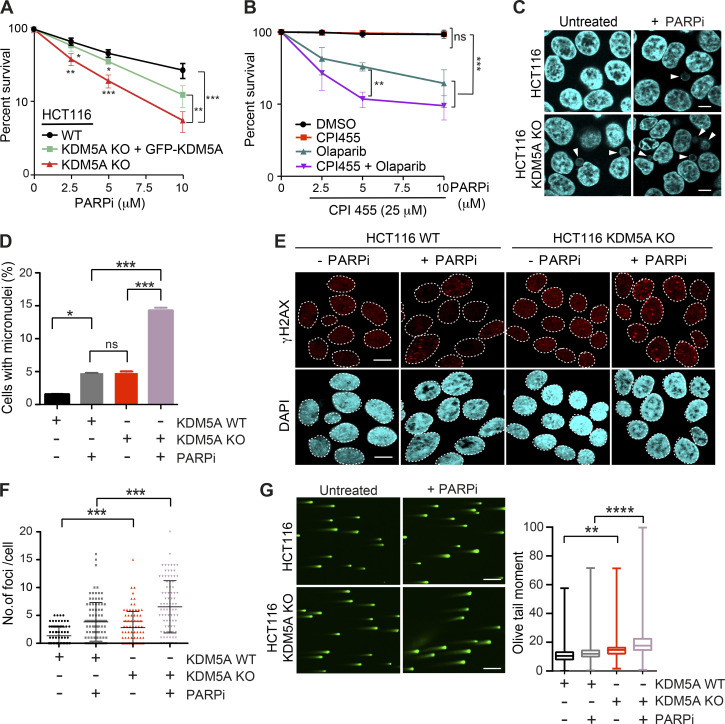
Figure 1.
KDM5A deficiency results in genome instability and sensitivity to PARP inhibition. (A) Clonogenic survival assay of HCT116 WT, KDM5A-KO, and KDM5A-KO + GFP-KDM5A complemented cells. Cells were treated with the PARPi olaparib at the indicated doses for 24 h, and colonies were quantified after 2 wk. Error bars represent SD; n = 3. (B) Clonogenic survival assay of U2OS cells treated with DMSO, 25 µM CPI455, and olaparib at the indicated doses for 24 h. Colonies were analyzed as in A. Error bars represent SD; n = 3. (C) KDM5A suppresses micronuclei formation. HCT116 WT and KDM5A-KO cells were treated with 5 µM olaparib for 24 h and immunostained with DAPI to detect micronuclei. Scale bars, 10 µm. White arrowheads mark micronuclei. (D) Quantification of C. n = 2; >100 cells quantified per condition per replicate. (E and F) KDM5A deficiency leads to DNA damage that is exacerbated by PARP inhibition. HCT116 WT or KDM5A-KO cells were treated with or without 5 µM PARPi (olaparib) for 24 h and immunostained for the DNA break marker γH2AX. γH2AX foci are quantified and plotted in F. n = 2; >100 cells were quantified per condition per replicate. Error bars represent SEM. Scale bars, 20 µm. (G) Loss of KDM5A increases DSBs as detected by neutral comet assay. Cells were treated as in C. Scale bars, 100 µm. Right panel: quantification of left panel. Olive tail moment for >100 cells quantified per condition per replicate and plotted as a box and whiskers; n = 2. Error bars represent SEM. P values were calculated by Tukey’s multiple comparison test. P values for A, B, D, and E were calculated with unpaired Student’s t test (*, P < 0.05; **, P < 0.01; ***, P < 0.001; ****, P < 0.0001).

