Figure S1.
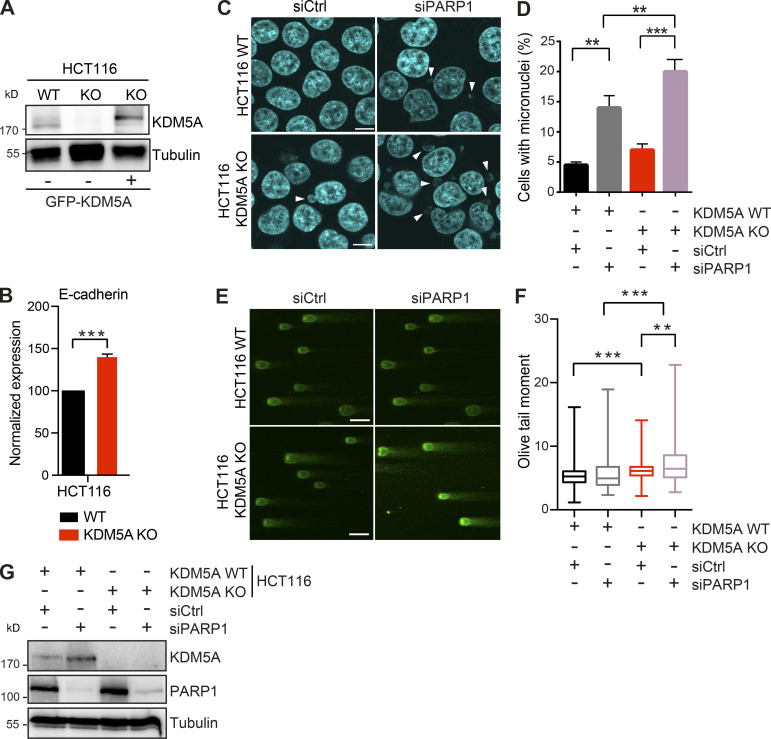
KDM5A loss results in reduced genome integrity in siPARP1-depleted HCT116 cells. Related to Fig. 1. (A) WB analysis of cell lines from Fig. 1 A with the indicated antibodies. (B) Gene expression analysis of E-cadherin in WT and KDM5A-KO HCT116 cells. Total RNA was isolated for each cell type and analyzed using gene-specific primers. Data are normalized to B2M, ALAS1, and WT samples. Shown is mean ± SEM (n = 3). P values were calculated by unpaired Student’s t test (***, P < 0.001). (C) Micronuclei formation analysis in HCT116 WT and KDM5A-KO cells with or without siPARP1. PARP1 was depleted by siRNA for 48 h followed by DAPI staining to detect micronuclei. Scale bars, 10 µm. White arrowheads mark micronuclei. (D) Quantification of C. n = 2 with >100 cells quantified per condition per replicate. P values were calculated by unpaired Student’s t test (**, P < 0.01; ***, P < 0.001). (E) KDM5A loss results in increased DSBs as detected by neutral comet assay in cells deficient for PARP1. Cells were treated as in C and analyzed by comet assay as in Fig. 1 G. (F) Quantification of E. Olive tail moment for >100 cells quantified per condition per replicate and plotted as a box and whiskers; n = 2. P values were calculated by Tukey’s multiple comparison test (**, P < 0.01; ***, P < 0.001). (G) Validation of PARP1 protein depletion by siRNAs. WT and KDM5A-KO HCT116 cells were treated with siCtrl or siPARP1, and samples were evaluated by WB analysis with the indicated antibodies 48 h after transfection of the siRNAs. Error bars in B, D, and F represent SEM.

