Figure S2.
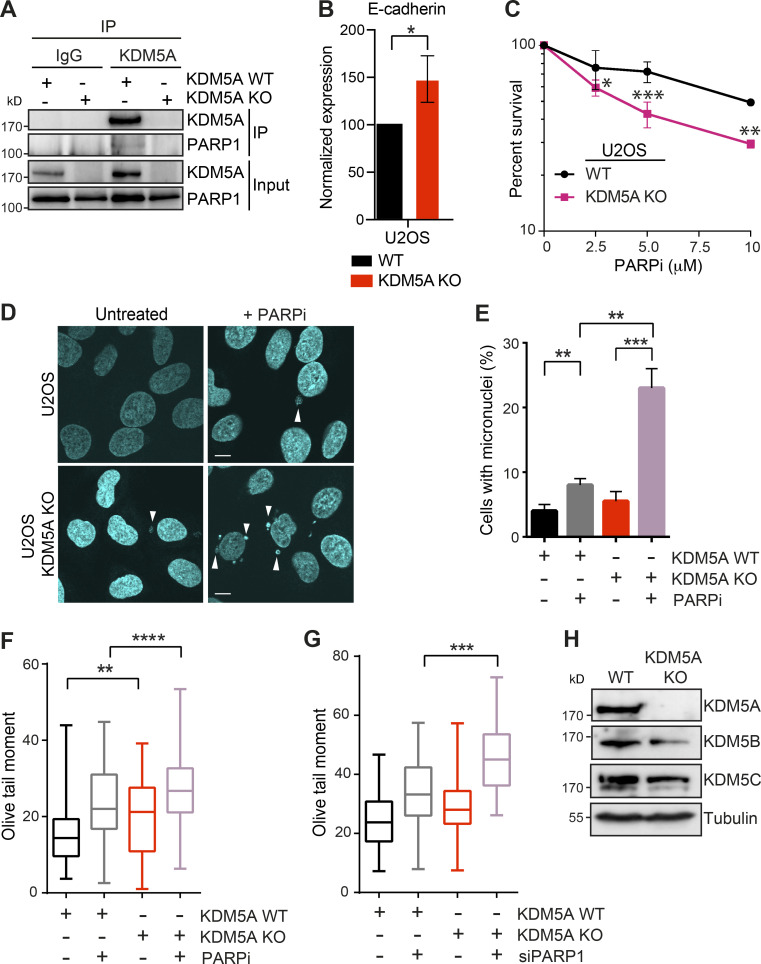
KDM5A loss results in reduced genome integrity in siPARP1-depleted U2OS cells. Related to Fig. 1. (A) KDM5A co-IP and WB analysis in U2OS cells. KDM5A was immunoprecipitated from WT and KDM5A-KO cells, and precipitates were evaluated by WB analysis with the indicated antibodies. Analysis confirms loss of KDM5A protein in KDM5A-KO cells. (B) Gene expression analysis of E-cadherin in WT and KDM5A-KO U2OS cells. Experiments were performed as in Fig. S1 B. n = 3. Error bars represent SEM. P values were calculated by unpaired Student’s t test (*, P < 0.05). (C) U2OS cells lacking KDM5A are sensitive to PARPi. Experiments were performed as in Fig. 1 A. Error bars represent SD; n = 3. (D) Loss of KDM5A increases micronuclei in U2OS cells treated with PARPi. Experiments were performed as in Fig. 1 C. Scale bars, 10 µm. White arrowheads mark micronuclei. (E) Quantification of D. >100 cells were quantified per condition per replicate; n = 2. (F and G) KDM5A loss in U2OS cells results in persistent DSBs as detected by neutral comet assay in cells deficient for PARP1 by either inhibition (F) or siRNA depletion (G). Cells were treated and analyzed as in Fig. 1 G and Fig. S1 E. Olive tail moment for >100 cells quantified per condition per replicate; n = 2. Error bars represent SEM. P values were calculated by Tukey’s multiple comparison test (*, P < 0.05; **, P < 0.01; ***, P < 0.001; ****, P < 0.0001). (H) WB analysis of KDM5 proteins in WT and KDM5A-KO HCT116 cells. P values were calculated by unpaired Student’s t test for B, C, and E (*, P < 0.05; **, P < 0.01; ***, P < 0.001; ****, P < 0.0001).

