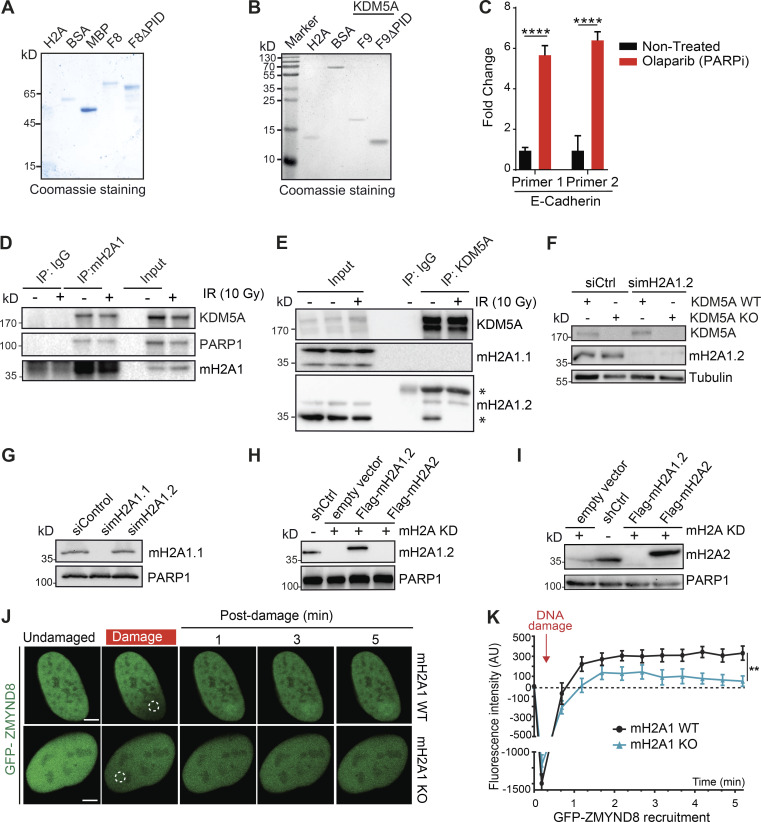
Figure S5.
DNA damage recruitment dynamics, dependencies, and interactions. Related to Figs. 4, 5, 6, and 7. (A and B) Purified proteins from Fig. 4, G and I, respectively, were analyzed by Coomassie blue staining after SDS-PAGE. (C) PARPi treatment increases E-cadherin expression. U2OS cells were treated with 25 µM PARPi for 16 h, and samples were analyzed by RT-qPCR. E-cadherin expression was normalized to untreated and GAPDH. Error bars are SEM; n = 3. P values were calculated by unpaired Student’s t test (****, P < 0.0001). (D) Co-IP with endogenous macroH2A1 was performed as in Fig. 2 A. (E) KDM5A interacts with macroH2A1.2 but not macroH2A1.1. Co-IP with endogenous KDM5A from HEK293T cells was performed as in Fig. 2 A. Asterisks mark bands that are not full-length/unmodified macroH2A1. (F) Validation of macroH2A1.2 antibody. KDM5A WT and KDM5A-KO HCT116 cells were treated with siCtrl or simacroH2A1.2 and evaluated by WB analysis with the indicated antibodies 48 h after transfection. (G) Validation of macroH2A1.1 antibody. HEK293T cells were treated with siCtrl, simacroH2A1.1, and simacroH2A1.2 and analyzed as in F. (H and I) WB analysis of HEPG2 macroH2A variant–expressing cells. Samples from Fig. 6 B were probed with macroH2A1.2 (H) and macroH2A2 (I) antibodies to confirm expression of these variants in these cells. (J) Damage recruitment of GFP-ZMYND8 is abolished in macroH2A1-KO U2OS cells. Dotted white circles indicate damaged region. Scale bars, 5 µm. (K) Quantification of J. n > 10 cells. Error bars represent SEM. P values were calculated by unpaired Student’s t test (**, P < 0.01).

