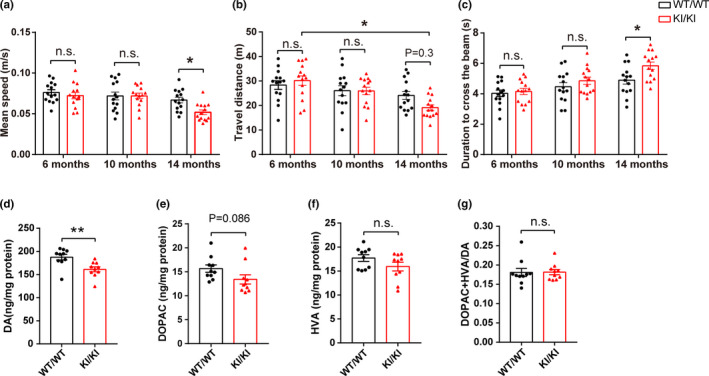
FIGURE 1.

Behavioral and neurochemical characterization of VPS35 D620N KI mice. (a) Mean speed in the open field test. (b) Total travel distance in open field test. (c) Duration to cross the narrow beam (9 mm) in beam walking test. Dots in figure histograms indicate single animals (the same with other figures). (n = 13–14/group, two‐way ANOVA with Tukey's post hoc test). (d–g) Concentrations of DA (d), DOPAC (e), HVA (f) and DA turnover rate (DOPAC+HVA/DA) (g) in VPS35D620N / D620N mice (KI/KI) compared with WT littermate control mice (WT/WT) at age of 15–16 months (n = 9–10/group, Student's t test, unpaired, two‐tailed). Data are shown as mean ± SEM; *p < 0.05; **p < 0.01; n.s., not significant
