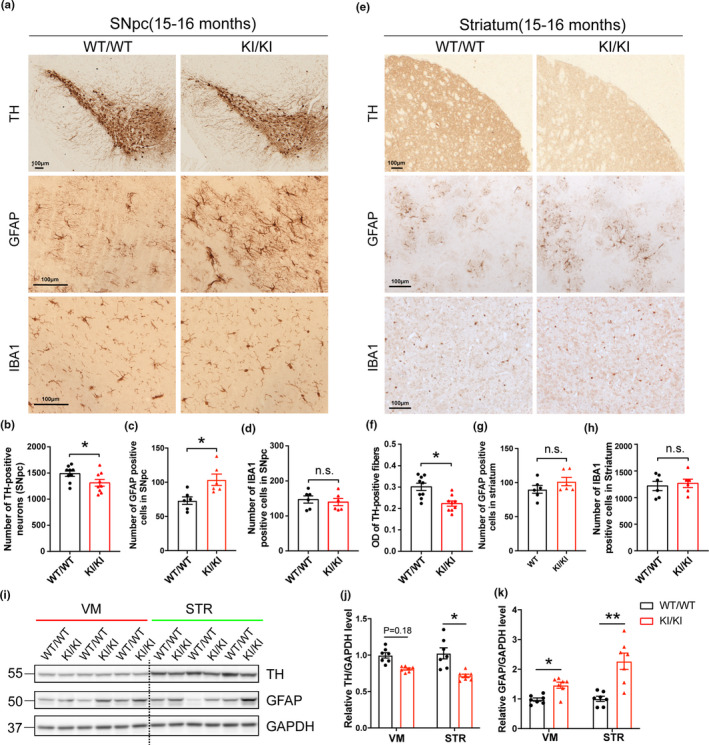
FIGURE 2.

Neuropathological changes in VPS35 D620N KI mice. (a,e) Representative images of TH, GFAP and IBA1 immunostaining in SNpc (a) and STR (e) of 15‐ to 16‐month‐old VPS35D620N / D620N and WT mice (n = 6–9/group). Scale bar, 100 μm. Quantification of TH‐positive neurons (b), GFAP‐positive cells (c) and IBA1‐positive cells (d) in SNpc. Quantification of optical density (OD) of TH‐positive fibers (f), GFAP‐positive cells (g), and IBA1‐positive cells (h) in STR. (i–k) Representative Western blots (i) and quantification of TH (j) and GFAP (k) in VM and STR extracts from 15‐ to 16‐month‐old VPS35D620N / D620N mice and WT controls (n = 7/group). Student's t test, unpaired, two‐tailed; data are shown as mean ± SEM; *p < 0.05; **p < 0.01; n.s., not significant
