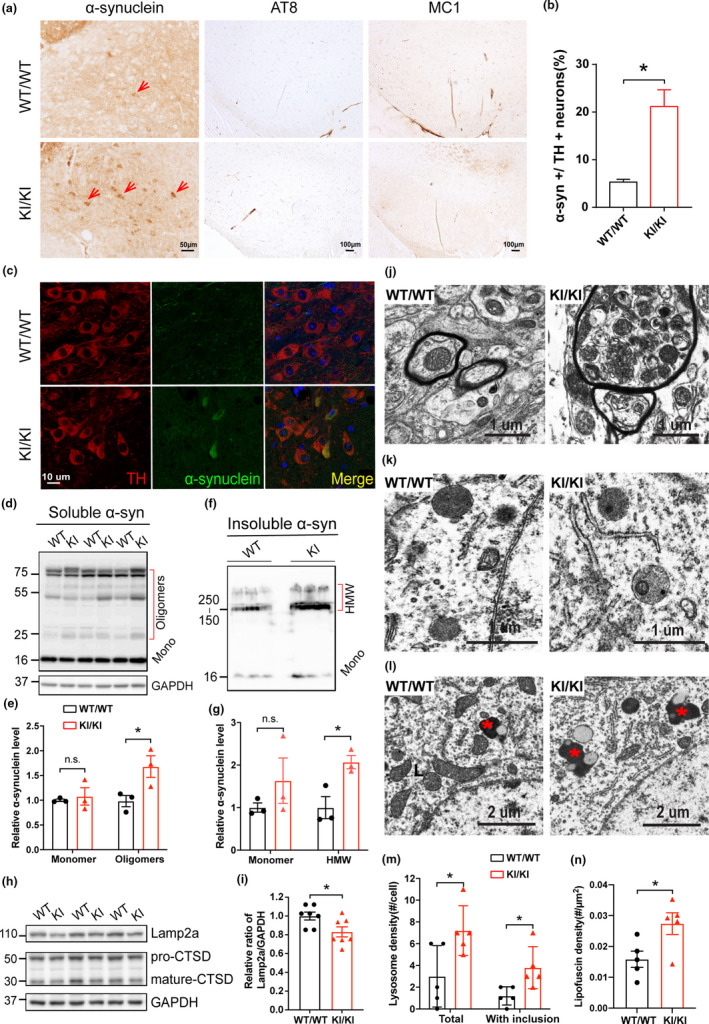
FIGURE 3.

Accumulation and aggregation of α‐synuclein in VPS35 D620N KI mice. (a) Representative images show immunohistochemical staining of α‐syn in SNpc from 15‐ to 16‐month‐old VPS35D620N / D620N mice and WT controls. Scale bar, 50 μm. (b) Quantification of α‐syn somatic accumulation in total TH+ neurons (%) in SNpc (n = 4; unpaired t test). (c) Confocal microscopy demonstrated colocalization of α‐syn (Green) and TH (Red) in SNpc from 15‐ to 16‐month‐old VPS35D620N / D620N mice and WT controls. (d–e) Western blots (d) and quantification (e) of α‐syn monomers and oligomers in Triton‐soluble fractions in VM from 15‐ to 16‐month‐old VPS35D620N / D620N mice and WT controls (n = 3; two‐way ANOVA with Tukey's post hoc test). (f–g) Western blots (f) and quantification (g) of α‐syn monomers and HMW bands in Triton‐insoluble fractions in VM from VPS35D620N / D620N mice and WT controls (n = 3; unpaired t test). (h–i) Representative Western blots (h) and quantification (i) of Lamp2a and Cathepsin D in VM from VPS35D620N / D620N mice and WT controls (n = 7; unpaired t test). (j) Representative electron microscopic image of dystrophic myelinated axons with autophagic vesicles in SNpc from 14‐month‐old VPS35D620N / D620N mice. (k) Lysosomes in SNpc neurons from 14‐month‐old WT with few dense bodies and from VPS35D620N / D620N mice with frequent inclusions, and quantification (m) (n = 5, unpaired t test). (l) Lipofuscins in SNpc neurons from 14‐month‐old WT and VPS35D620N / D620N mice, and quantification (n) (n = 5, unpaired t test, asterisk indicates lipofuscin). Data are shown as mean ± SEM; *p < 0.05, n.s., not significant
