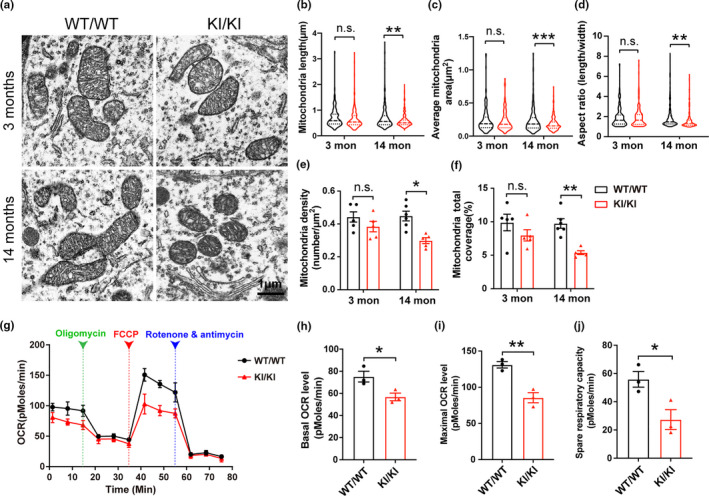
FIGURE 4.

Mitochondrial morphology and respiratory deficits in VPS35 D620N KI mice. (a) Representative electron microscopy picture from SNpc of VPS35D620N / D620N mice and WT controls at different ages as indicated. Scale bar, 1 μm. (b–f) Quantification of mitochondrial length (b), average mitochondria area (c), aspect ratio (d), mitochondrial density (e), and percentage coverage of cytoplasm by mitochondria (f), (200–350 mitochondria from 5 to 6 neurons per group; (b–d) were showed in violin plot; two‐way ANOVA with Tukey's post hoc test; mean ± SEM; *p < 0.05, **p < 0.01, ***p < 0.001, n.s., not significant). (g) Respiratory activity of synaptic mitochondria freshly isolated from cortex of 15‐month‐old VPS35D620N / D620N mice and control mice was analyzed by Seahorse XFe96 Assay. (h–j) Quantification of basal OCR (h), maximal OCR (i), and spare OCR (j) (Data are means ± SEM of 3 mice; unpaired t test; *p < 0.05, **p < 0.01, n.s., not significant)
