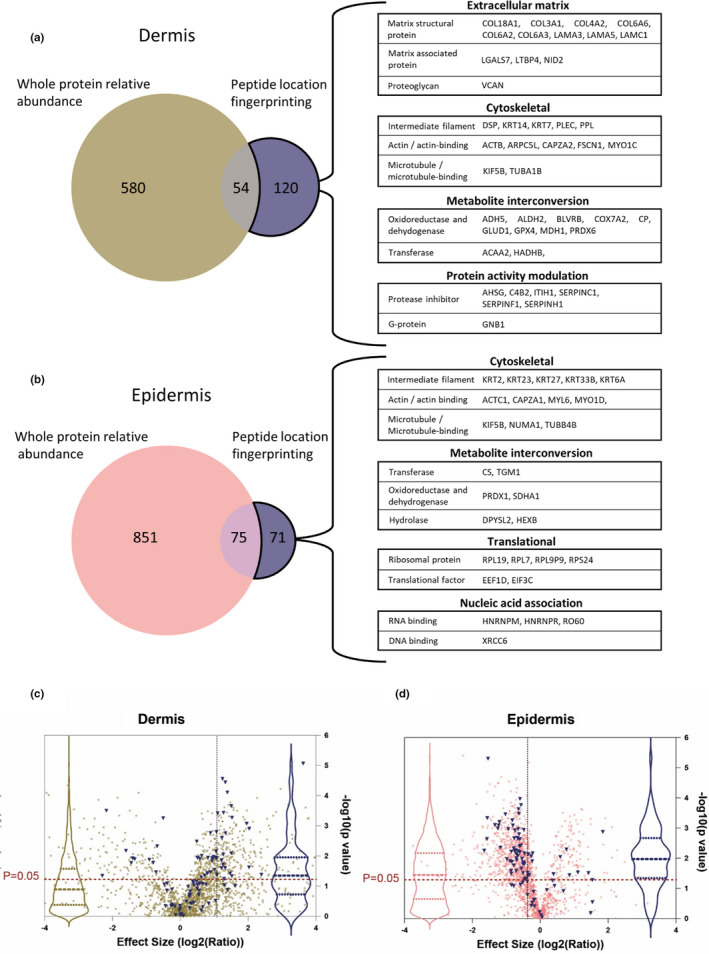
FIGURE 5.

Peptide location fingerprinting identifies unique modification‐specific skin biomarker candidates of photoageing which were not identified by whole protein relative quantification. Venn diagrams compare the number photoageing‐modified protein biomarker candidates identified by peptide location fingerprinting with the number identified with significant differences in whole protein relative abundance by quantification with MS1 intensity. Several proteins were uniquely identified by peptide location fingerprinting in both dermis (a) and epidermis (b) including multiple ECM proteins and protein activity modulators for dermis, translation and nucleic acid‐associated proteins for epidermis and cytoskeletal proteins and metabolite interconversion enzymes for both sub‐tissues. Protein identities with significant modifications in structure correlated less strongly with significant differences in protein abundance in the dermis (c) than in the epidermis (d). Proteins with photoageing‐specific structural modifications were identified and labelled blue on relative protein abundance volcano plots from Figure [Link], [Link]. Violin plots (dashed lines = median and IQR) of the labelled points (blue) were superimposed to show correlation between proteins with modification‐associated differences and protein abundance differences (violin plots of all data points also shown in pink and gold). For the epidermis, a large proportion of proteins which had structural modifications (blue points and blue violin plot) are positioned above the p = 0.05 line, indicating that these were also significantly different in relative abundance between photoaged forearm and intrinsically aged buttock. This suggests that for epidermis, structure‐related differences appear to correlate strongly with differences in abundance (median p‐value = 0.01). For the dermis, however, a smaller proportion of proteins identified with modification‐associated differences are positioned above the p = 0.05 line suggesting that these differences appear to correlate less with abundance (median p‐value = 0.04).
