
Figure 4. In vitro RHPs recapitulate in vivo programs of heterogeneity.
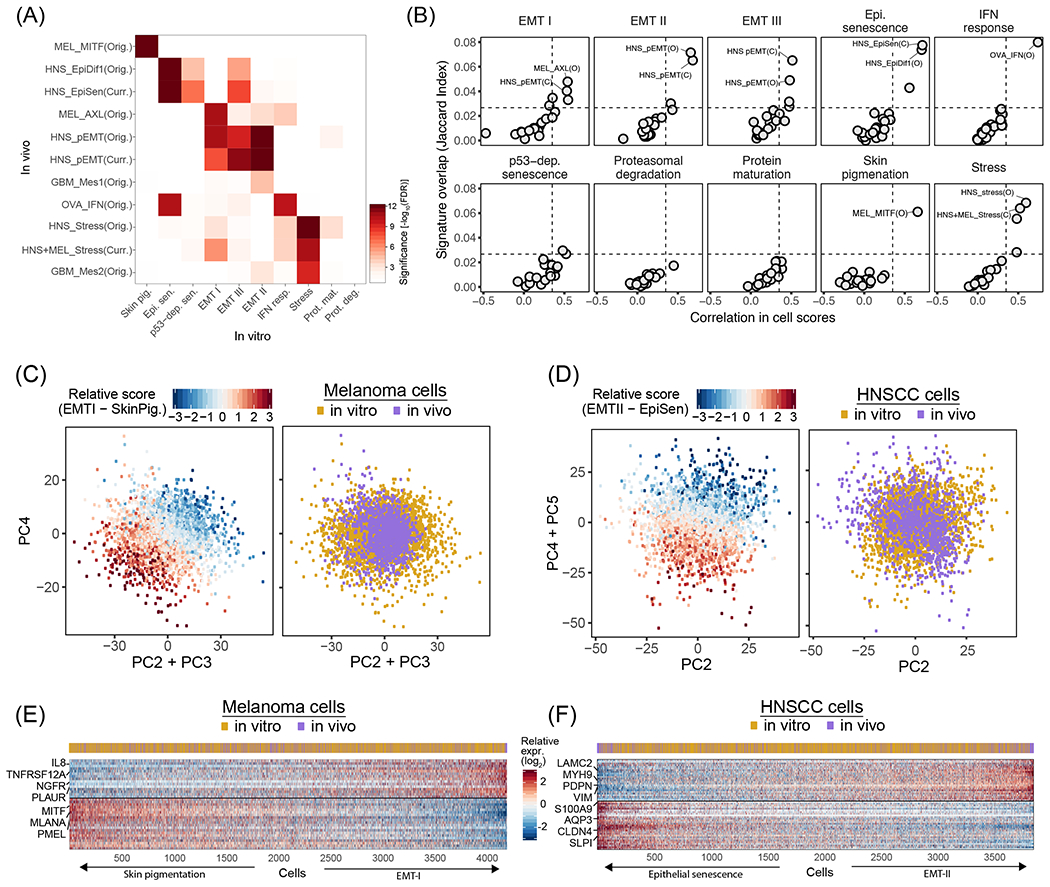
(A) Significance of the overlap (−log10(P) for FDR-adjusted hypergeometric test), between RHP gene-sets defined in cell lines (in vitro, X-axis) and in tumors (in vivo, Y-axis). In vivo RHPs are named by a cancer type abbreviation (MEL: melanoma, HNS: HNSCC, GBM: glioblastoma, OVA: ovarian cancer), followed by an associated functional annotation, and whether it was defined by the original study (Orig.) or the current study (Curr., see Fig. S3). (B) Each panel shows the mean Jaccard index (Y-axis) and mean correlation of single cell scores (X-axis) between the NMF programs constituting a specific In vitro RHP (as noted at the top) and all In vivo RHPs. The most similar In vivo RHPs are labeled as in (A). Dashed lines indicate a 99.9% confidence threshold determined by permutations of NMF programs. (C) Scatterplots of melanoma cells based on PC2+PC3 (X-axis) and PC4 (Y-axis). Cells are colored by the relative score for EMT-I and SkinPig genes shared between cell lines and tumors RHPs (left panel) and by whether the cells are from tumors or cell lines (right panel). (D) Scatterplots of HNSCC cells based on PC2 (X-axis) and PC4+PC5 (Y-axis). Cells are colored by the relative score for EMT-II and EpiSen genes shared between cell lines and tumors RHPs (left panel) and by whether the cells are from tumors or cell lines (right panel). (E) Heatmap showing the relative expression of shared EMT-I and SkinPig RHP genes (rows) across melanoma cells (columns), sorted by the relative RHP scores. The cells’ origin from tumors or cell lines is shown by the top panel. (F) Heatmap showing the relative expression of shared EMT-II and EpiSen RHP genes (rows) across HNSCC cells (columns), sorted by the relative RHP scores. The cells’ origin from tumors or cell lines is shown by the top panel.