
Figure 7. Co-existing cellular states differ in drug sensitivity.
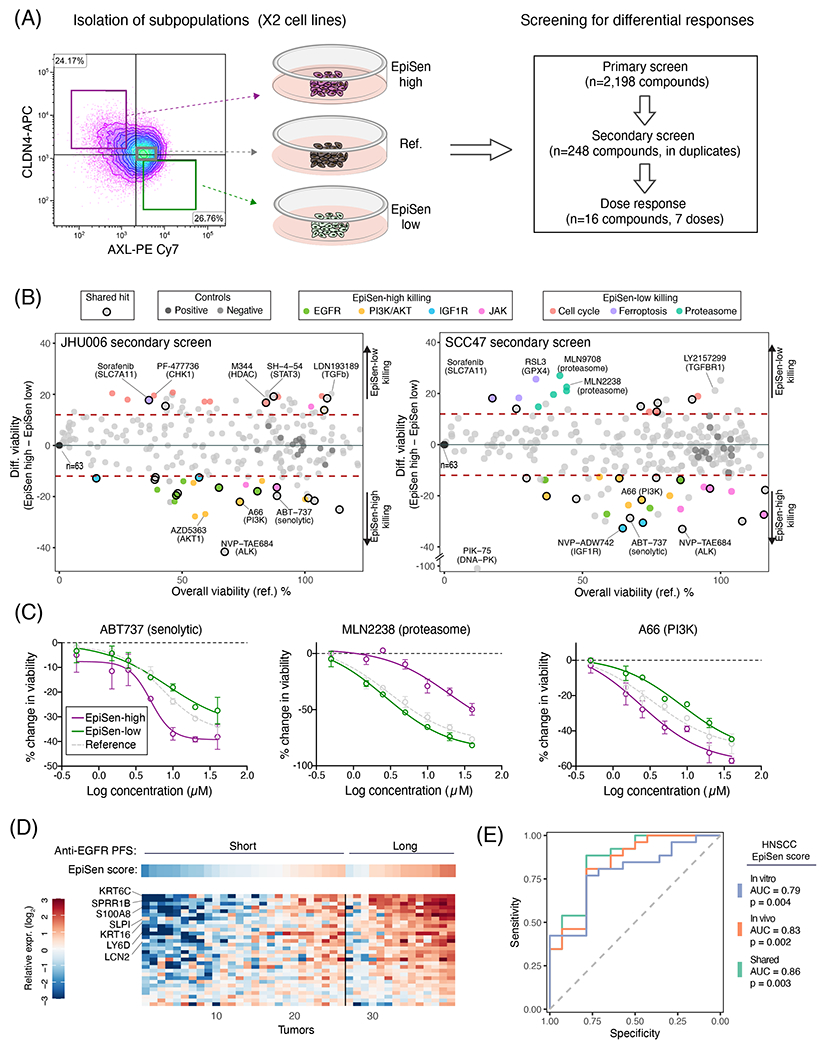
(A) Experimental scheme for drug screening: three subpopulations were isolated by FACS and subjected to primary screen, secondary screen and dose response analysis of selected hits. (B) Viability of the reference population (X-axis) and differential viability of the EpiSen-high vs. EpiSen-low populations (Y-axis) upon treatment with 248 compounds tested in the secondary screen, in JHU006 (left) and SCC47 (right), averaged over 2 replicates. Dotted lines represent thresholds for differential sensitivity (as described in Methods). Selected hits and controls are colored by target as specified in the top legends. (C) Dose response curves of three selected compounds in SCC47 measured in duplicate at each concentration, presented by the change in viability relative to vehicle controls. Error bars represent standard deviation. (D) Heatmap showing the expression of EpiSen genes shared between the HNSCC cell lines (in vitro) and tumors (in vivo) programs (see fig. S12) in bulk pre-treatment samples of 40 recurrent or metastatic HNSCC patients, stratified into short and long PFS following treatment with Cetuximab plus platinum-based chemotherapy. Top panel shows the corresponding EpiSen scores. Genes are ordered by differential expression (log2(fold change)) comparing short and long PFS patients, and tumors are ordered within each group according to the EpiSen score. Selected genes are labeled. (E) Receiver operating characteristic (ROC) curves for prediction of long vs. short PFS patients following Cetuximab treatment. Curves depict the predictive power of three potential HNSCC EpiSen signatures (in vitro, in vivo and shared). P values were calculated for each signature separately using multivariate logistic regression correcting for relevant clinicopathological features.