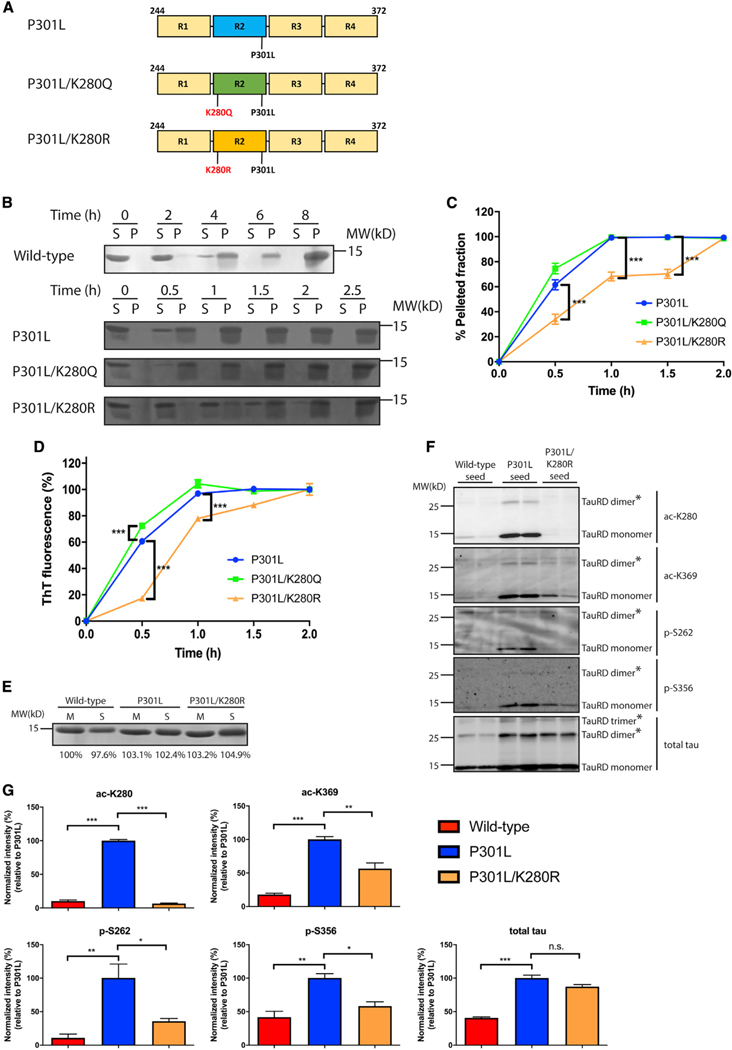
Figure 3. Acetylation promotes tau seed pathogenesis.
(A) Schematic representation of P301L tau, acetylation-mimic (P301L/K280Q), and non-mimic (P301L/K280R) tau constructs used in this study.
(B) Fibrillization of WT, P301L, P301L/K280Q, or P301L/K280R was performed for up to 8 h (WT) or 2.5 h (P301L, P301L/K280Q, and P301L/K280R). Samples were sedimented into supernatant (S) and pellet (P) fractions and analyzed by Coomassie blue staining.
(C) Quantification of the sedimentation assay showed increased pelleted fractions with P301L and P301L/K280Q compared to P301L/K280R. Error bars indicate SEM; n = 3 biologically independent experiments. p value was determined by unpaired t test. ***p < 0.001.
(D) In vitro tau aggregation was monitored by thioflavin-T measurements for up to 2 h to analyze the aggregation kinetics among tau seeds. Error bars indicate SEM; n = 3 biologically independent experiments. p value was determined by unpaired t test. ***p < 0.001.
(E) Coomassie blue staining of WT, P301L, or P301L/K280R tau monomers (M) and seeds (S) are depicted as loading controls. Band intensity was quantified and normalized to WT monomer.
(F) Primary neurons were treated with WT, P301L, or P301L/K280R tau seeds and analyzed by immunoblotting with site-specific tau antibodies (ac-K280, ac-K369, p-S262, and p-S356). The asterisks (*) highlight multimeric tau dimers and trimers.
(G) Quantification of the site-specific tau modifications detected on WT, P301L, or P301L/K280R tau seeds after neuron processing. The extent of tau modifications was normalized to total tau levels. Error bars indicate SEM; n = 3 biologically independent experiments. p value was determined by one-way ANOVA with Tukey’s test for multiple comparisons among groups. n.s. p > 0.05, *p < 0.05, **p < 0.01, ***p < 0.001.

