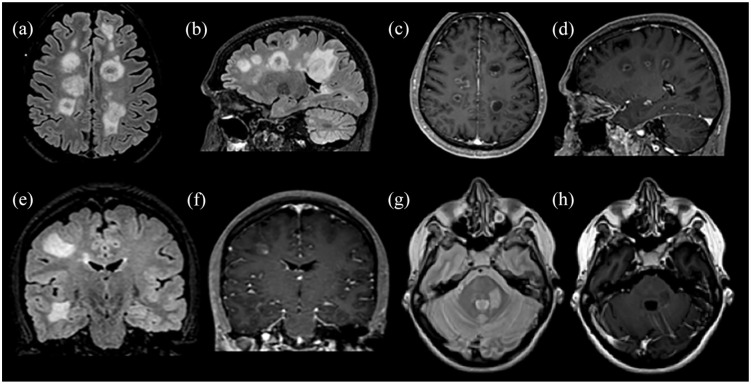
Figure 3.
Representative examples of MS patients presented with tumefactive lesions after fingolimod cessation and after fingolimod or natalizumab initiation. Patient 1 developed five TDLs [(a) and (b)] 5 months after fingolimod cessation with both closed and open ring Gd+ pattern [(c) and (d)]. Patient 2 presented with two TDLs [(e)] with heterogeneous Gd+ [(f)] 3 months after natalizumab initiation in the right frontal and right temporal lobes. MRI of a third patient with a TDL in the left middle cerebellar peduncle [(g)] 1 month after fingolimod initiation with subtle Gd+ [(h)].
FLAIR images: (a), (b), (e). T2-weighted image: (g). T1-weighted contrast-enhanced images: (c), (d), (f), (h).
FLAIR, fluid-attenuated inversion recovery; Gd+, gadolinium enhancement; MRI, magnetic resonance imaging; TDL, tumefactive demyelinating lesion.

