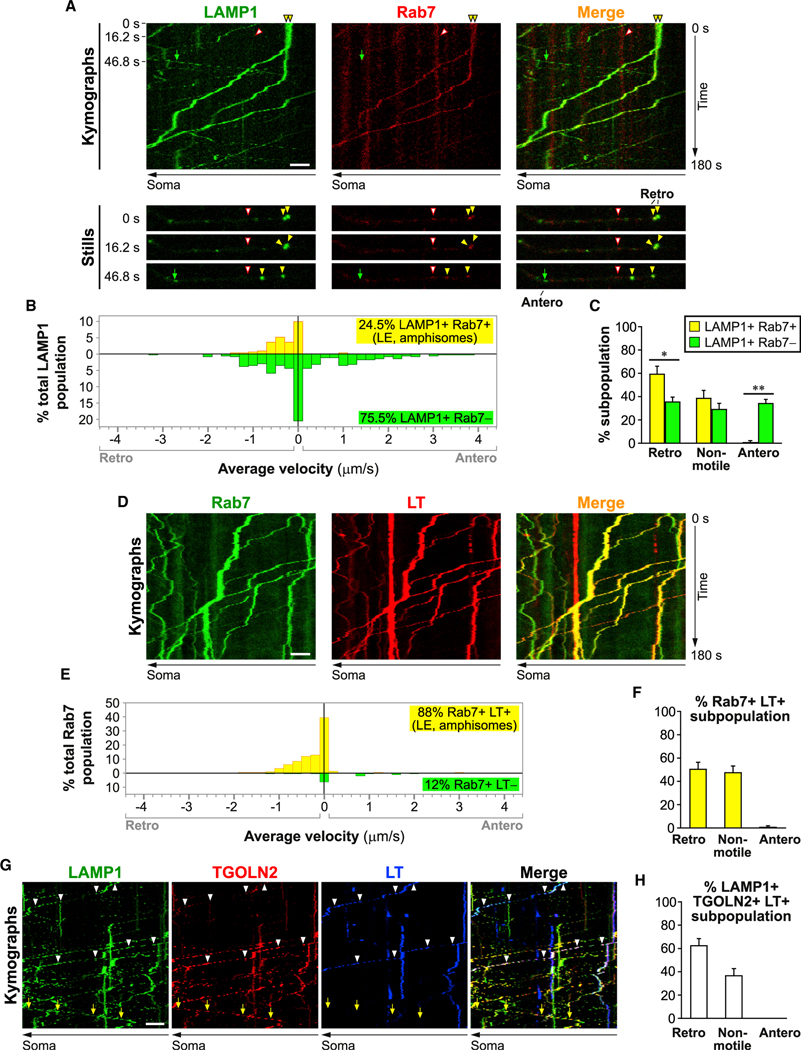
Figure 6. Axonal late endosomes are acidic and undergo retrograde axonal transport.
Time-lapse imaging in axonal segments of neurons expressing LAMP1-YFP and Rab7-DsRed (A–C), or expressing Rab7-eGFP co-labeled with LysoTracker (LT)-Red (D–F), or co-expressing LAMP1-YFP, TGOLN2-mCherry, and co-labeled with LT-Deep Red (G and H).
(A, D, and G) Representative kymographs and still images. Scale bar, 5 μm. Complete arrows, anterograde; closed arrowheads, retrograde: open arrowheads, non-motile.
(B and E) Histograms showing the distribution of average velocities in LAMP1 vesicle subpopulations (n = 335 vesicles in 7 cells) and Rab7 vesicle subpopulations (n = 208 vesicles in 10 cells). Retro, retrograde; Antero, anterograde.
(C, F, and H) Percentage of retrograde, non-motile (<0.1 μm/s) and anterograde vesicles in specified LAMP1 vesicle subpopulations (C) (n = 7 cells), Rab7+ LT+ vesicle subpopulation (F) (n = 10 cells) and LAMP1+ TGOLN+ LT+ vesicle subpopulation (H) (n = 14 cells). Bars, mean ± SEM (*p < 0.05, **p < 0.01, Mann-Whitney U test). See also Figures S3–S6.

