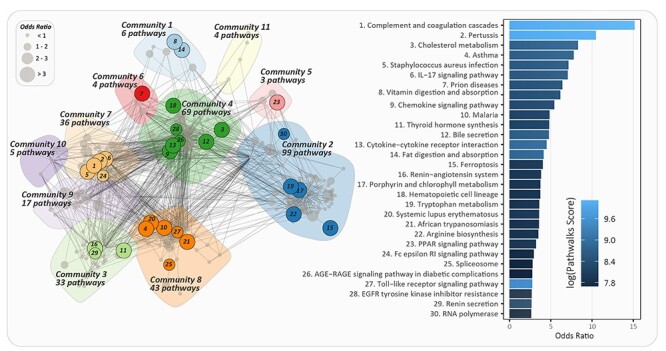
Figure 4 .

Connected pathway communities related to COVID-19 on a pathway-to-pathway network as highlighted by PathWalks. The bar plot shows the odds ratio value for the top 30 KEGG pathways, found to be involved in COVID-19. The bar plot color scale represents the visit counts from less (dark blue) to more (light) frequently visited pathways.
