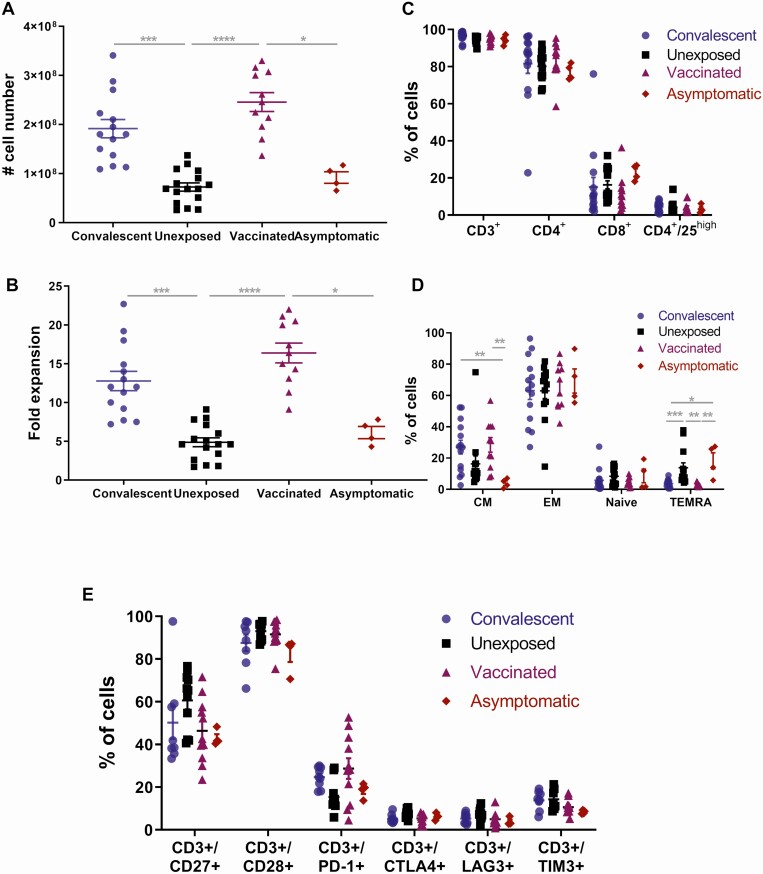
Figure 3.
Generation and phenotypic characterization of severe acute respiratory syndrome coronavirus 2–specific T cells from convalescent, unexposed, vaccinated, and asymptomatic donors. A and B, Absolute cell numbers (A) and fold expansion (B) of T-cell products generated after a 10-day culture from convalescent (dots; n = 14), unexposed (squares; n = 16), vaccinated (triangles; n = 11), and asymptomatic (rhombuses; n = 4) individuals. C–E, Immunophenotype of T-cell products generated after a 10-day culture from convalescent (dots; n = 14), unexposed (squares; n = 16), vaccinated (triangles; n = 11), and asymptomatic (rhombuses; n = 4) individuals. Each dot represents a single T-cell product. Differences between data sets were analyzed using Kruskal-Wallis test. *P ≤ .02; **P ≤ .009; ***P ≤ .001; ****P < ·0001. Abbreviations: CM, central memory; EM, effector memory; TEMRA, terminally differentiated effector memory expressing CD45RA.

