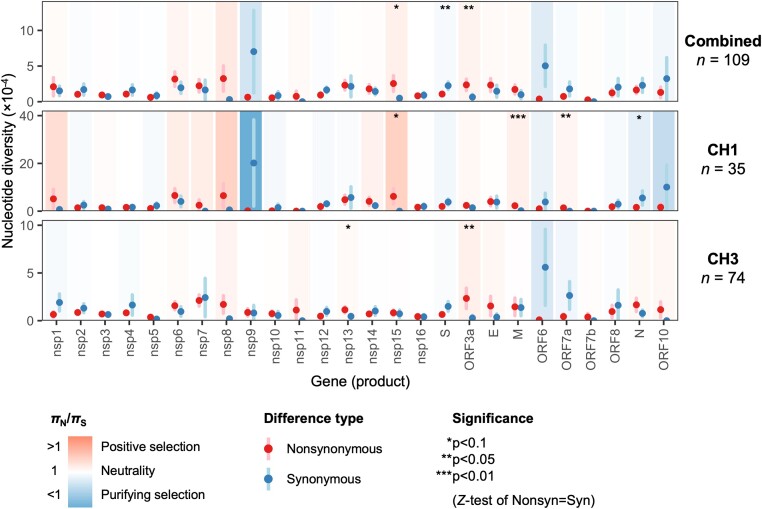
Figure 6.
Whole gene within-host nonsynonymous (πN) and synonymous (πS) nucleotide diversity in SARS-CoV-2 samples from the CH1 and CH3 outbreaks. Each gene/outbreak is shaded according to the normalized difference between mean nonsynonymous and synonymous differences per site (πN − πS) to indicate purifying selection (πN < πS; blue) or positive selection (πN > πS; red). Values of πN/πS range from a minimum of 0.007 (nsp9, CH1 outbreak; P = 0.257) to a maximum of 12.46 (M, CH1 outbreak; P = 0.00238), where significance was evaluated using Z-tests of the null hypothesis that πN − πS = 0 (10,000 bootstrap replicates, codon unit). Sites encoding two or more genes in different reading frames were excluded from analysis (e.g. ORF3a sites overlapping ORF3c, ORF3d, or ORF3b). Error bars represent the standard error, evaluated using 10,000 bootstrap replicates (codon unit).

