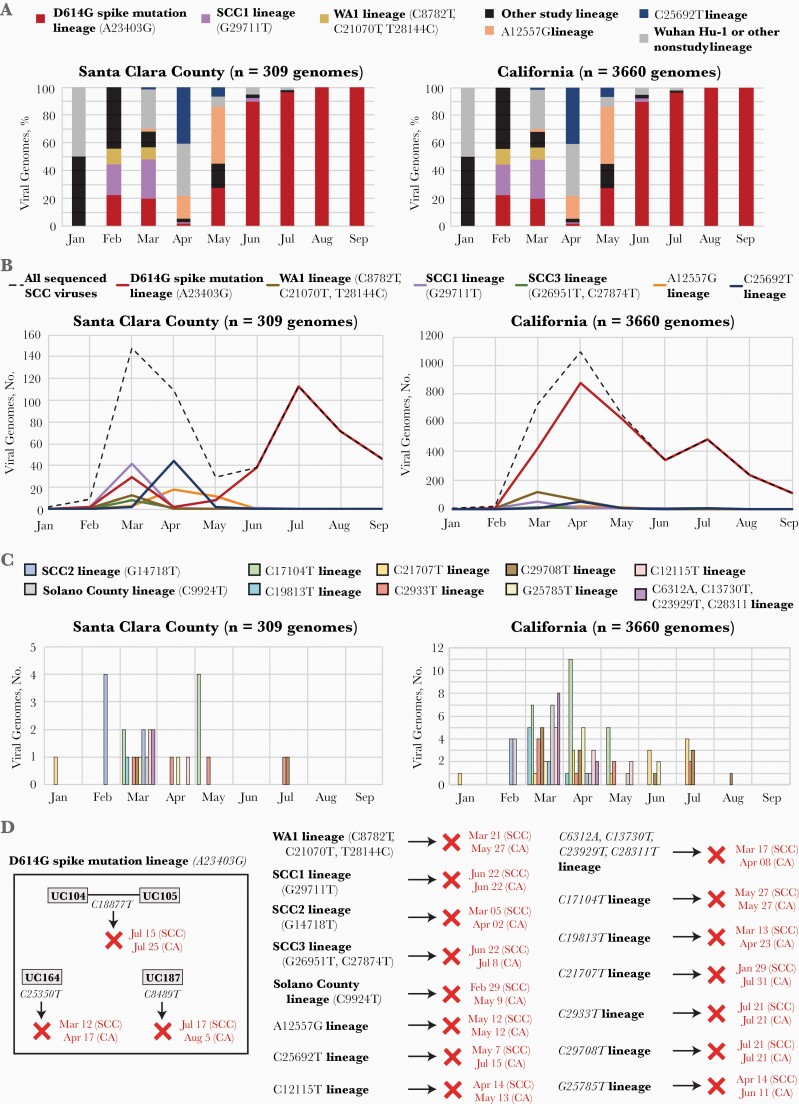
Figure 4.
Dynamic change of severe acute respiratory syndrome coronavirus 2 (SARS-CoV-2) genotypes in Santa Clara County (SCC) over time. A, Proportion of main viral lineages every month between January and September. B, Dynamic change curve of major viral lineages over time in the SCC community from January to September. The y-axis represents the number of SARS-CoV-2 cases. C, Bar graph of other viral lineages between January and September. D, Fate of the SARS-CoV-2 lineages identified in this study. The dates that the lineage was last identified in SCC and in California by genomic sequencing are provided in red text, with red X’s denoting disappearance of the lineage from the county by that date.

