Figure 3.
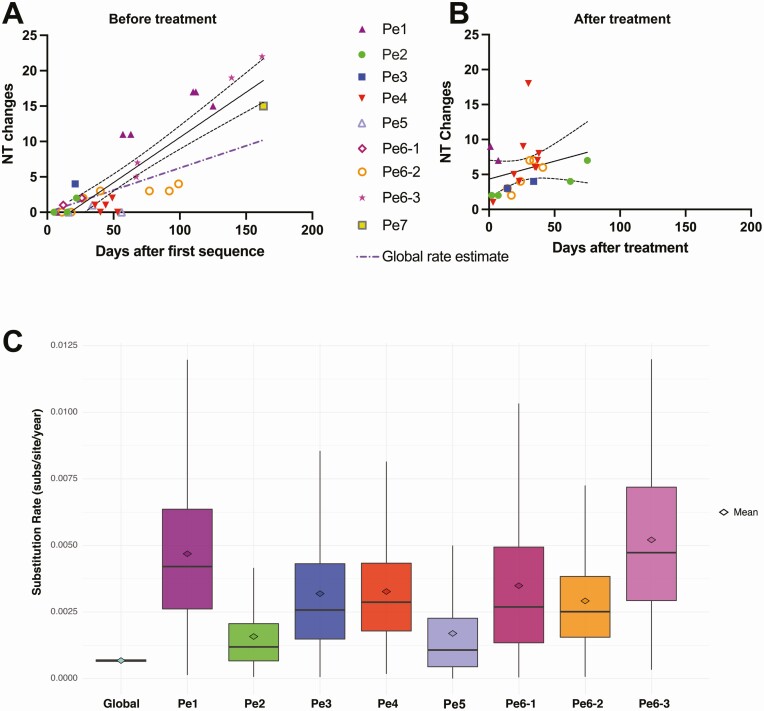
SARS-CoV-2 mutation location and evolutionary rate in the persistent COVID-19 cases. (A) Nucleotide substitution frequency pooled across all persistent cases for each SARS-CoV-2 gene. The dashed line indicates global substitution frequency across the whole genome. Substitution frequency for each gene was compared with the substitution frequency in the rest of the genome using Fisher’s exact tests. P values were corrected for multiple comparisons using the Bonferroni correction. *P < .05, and ***P < .001. (B) Nucleotide changes in samples taken prior to convalescent plasma or monoclonal antibody treatment relative to first sampled sequence in each persistently infected patient. Regression line and 95% confidence bands are shown. The purple dash-dotted line is the global rate estimate obtained from Nextstrain. (C) Nucleotide changes in samples taken after convalescent plasma or monoclonal antibody treatment relative to the last sample taken prior to treatment in each persistently infected patient. Regression line and 95% confidence bands are shown. (D) Substitution rate (nucleotide substitutions per site per year) of sampled global SARS-CoV-2 sequences relative to persistent patients based on Markov chain Monte Carlo time-measured phylogenetic reconstruction. Box plots show median and interquartile ranges of estimated substitution rates. The mean, median, and 95% HPD interval can be found in Supplementary Table 4. Abbreviations: COVID-19, coronavirus disease 2019; HPD, highest posterior density; Nt, nucleotide; Pe, persistent; SARS-CoV-2, severe acute respiratory syndrome coronavirus 2.

