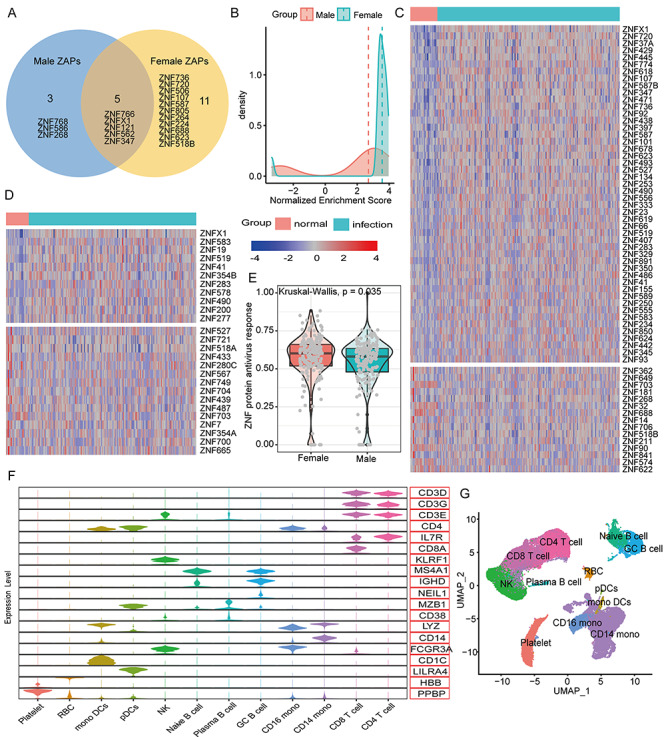
Figure 4.

The similarities and differences in the functions and activities of ZNF proteins in COVID-19 patients of different genders. (A) The Venn diagram shows the common and specific ZNF proteins of different genders. (B) The difference in protein activity of the 5 shared ZNF proteins after different genders were infected with the coronavirus SARS-CoV-2. The horizontal axis represents the normalized enrichment score used to predict the protein activity of ZNF proteins. The larger the value, the stronger the protein activity. The vertical axis represents the number of MRs. The red and green lines represent the median value. (C) The heat map shows the expression changes of differentially expressed ZNF proteins in normal women and COVID-19 women. (D) The heat map shows the expression changes of differentially expressed ZNF proteins in normal women and COVID-19 men. (E) Differences in the overall ZNF protein activity among COVID-19 patients of different genders. The ssGSEA algorithm was used to calculate the overall expression activity of ZNF family genes. (F) The violin chart shows the expression of marker genes in different cell populations. For more information and marker combinations, please refer to Figure S4, see Supplementary Data available online at http://bib.oxfordjournals.org/, and its legend. (G) UMAP cluster diagram shows the cell population identification of single cell sequencing of all samples.
