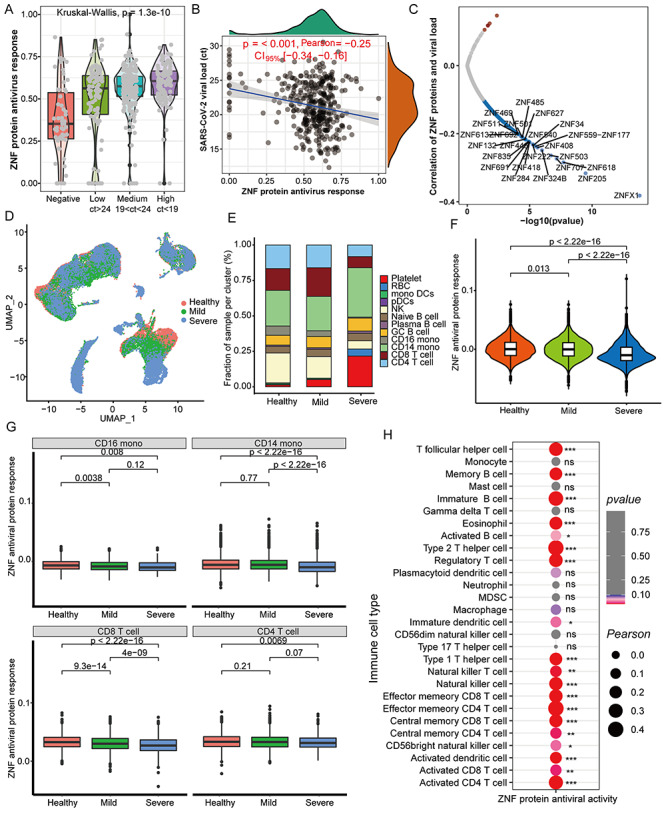
Figure 6.

The ZNF protein activity is negatively correlated with virus loads but positively correlated with certain immune cells. (A) Differences in overall ZNF protein activity between COVID-19 patients and healthy controls with different viral loads in the pharynx. The Ct value represents the content of the SARS-CoV-2 pharynx, and the quartile value is used to determine the low, medium and high viral loads. (B) Correlation between pharynx viral loads and the overall ZNF protein activity in COVID-19 patients. (C) The correlation between the viral load of the pharynx and the mRNA level of a single ZNF family gene in COVID-19 patients. (D) UMAP cluster diagram shows the single-cell distribution of healthy control, mild and severe COVID-19 patients. (E) Stacked box chart shows the changes in cell proportions in healthy, mild and severe patients. (F) Box chart displays the overall ZNF protein antiviral activity of patients with different disease classes (healthy, mild and severe). (G) Box chart displays the overall ZNF protein antiviral activity in CD16 monocytes, CD14 monocytes, CD8 T cells and CD4 T cells of different disease classes (healthy, mild and severe). (H) Correlation between the abundance of throat immune cells and the overall ZNF protein activity in COVID-19 patients. Kruskal–Wallis test was used for statistical significance.
