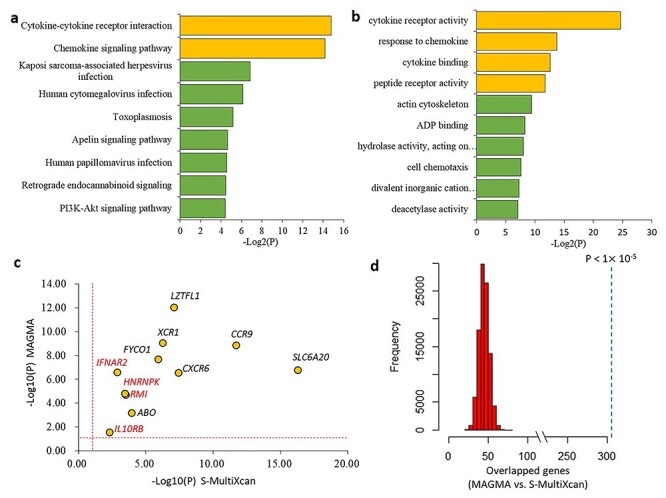
Figure 3 .

Functional enrichment analysis of genes associated with COVID-19. a) Pathway enrichment analysis identified 9 significant or suggestive KEGG pathways enriched by COVID-19-associated genes. b) GO enrichment analysis identified 10 significant or suggestive GO-terms enriched by COVID-19-associated genes. a and b) The green bar represents a suggestive enrichment (P < 0.05), and the orange bar represents a significant enrichment (FDR < 0.05). c) Scatter plot show the consistency of 11 risk genes identified from both MAGMA and S-MultiXcan analysis. The vertical and horizontal dotted lines represent -log10 (P = 0.05). d) In silico permutation analysis of 100 000 times of random selections. This permutation analysis was used to compare the overlapped genes between MAGMA and S-MultiXcan (see Methods). The empirical P value is less than 1 × 10⁻⁵.
