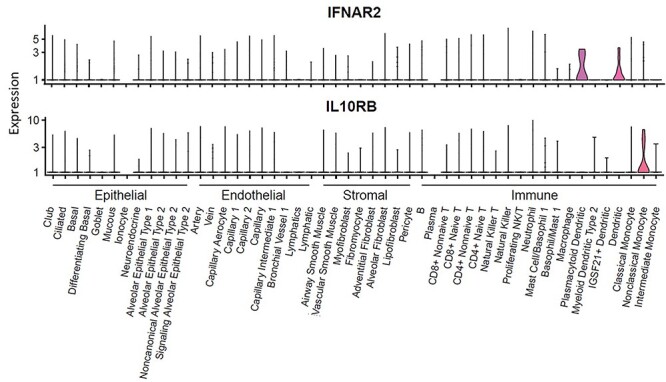
Figure 4 .

Expression of IFNAR2 and IL10RB among 50 cellular populations from lung tissue. This plot is based on a data set as a part of the Human Lung Atlas, consisting of 50 cell populations across 4 compartments (epithelial, endothelial, stromal, and immune) of lung tissue (x axis). y axis represents the expression level with log transformed count.
