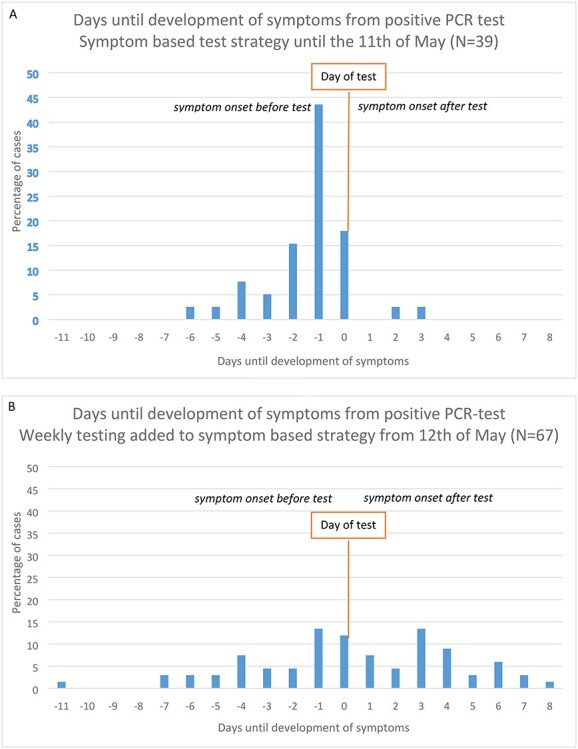
Figure 3 .

Frequency plot of days until development of symptoms from positive PCR-test of residents. Negative values represent symptomatic residents, while positive values represent presymptomatic residents. The value 0 means that residents developed symptoms at the day of PCR-test: whether the symptoms developed before or after testing determines if they were presymptomatic or symptomatic. (A) symptomatic testing strategy until the 11th of May. (B) Addition of facility-wide weekly testing strategy regardless of symptoms from the 12th of May.
