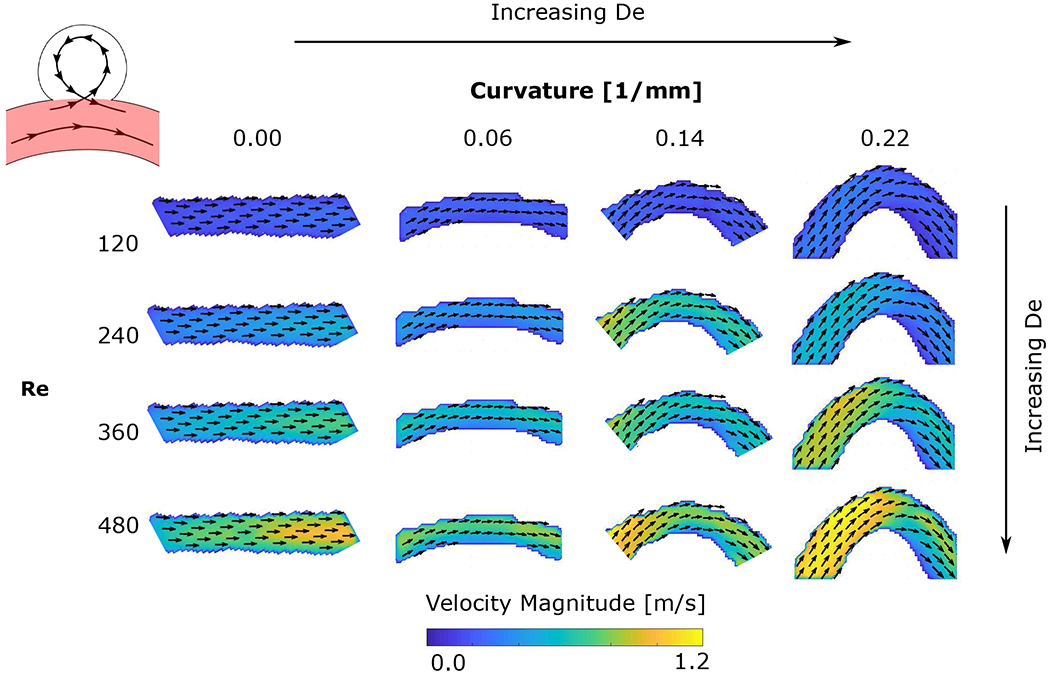
Figure 4:

Freestream velocity (in the parent vessel, highlighted in red on the aneurysm schematic), for different pipe curvature and inflow rates. The colours represent the velocity magnitude and the arrows represent the direction of the in-plane velocity, from left to right, correspond to increasing pipe curvature, κ, (Dean number increases diagonally from top left to bottom right), and rows, from top to bottom, correspond to increasing Reynolds number (inflow rate, Qpipe).
