Figure 2.
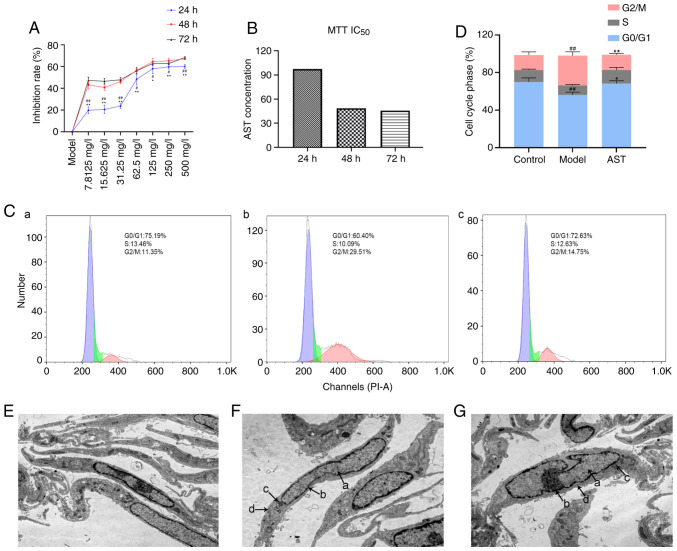
Effect of AST intervention on FLS proliferation, cell cycle progression and cell ultrastructure. (A) Inhibition rate in the groups treated with various concentrations of AST under different reaction times. #P<0.05 and ##P<0.01, compared with the 72-h intervention; *P<0.05 and **P<0.01, compared with the 48-h intervention. (B) IC50 value calculated by MTT assay. (C) Cell cycle phase was detected by flow cytometry. (a) Control group; (b) model group; (c) AST group. (D) Quantification of the cell cycle results. ##P<0.01, compared with the control group; **P<0.01, compared with the model group. (E) Control group (magnification, ×12,000). (F) Model group (magnification, ×12,000). (G) AST group (magnification, ×12,000). a, nucleus; b, nuclear membrane; c, mitochondria; d, endoplasmic reticulum; ALS, astragaloside; FLS, fibroblast-like synoviocyte.

