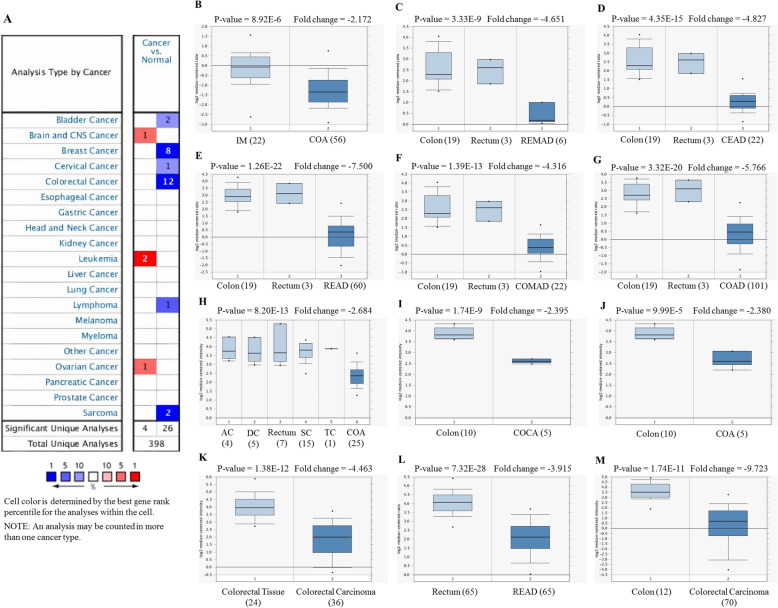
Fig. 2.
a Expression of PDE9A in different cancers from Oncomine database with significant mRNA depending on different types of cancer and corresponding normal tissue. Here, upregulation is marked in red and downregulation is blue. The threshold parameters were set as follows: P-value of 1E− 4, fold change 2, gene ranking 10%. b-m box plot comparing PDE9A expression in different colorectal cancer types (normal tissue in left and cancerous tissue in right) depicted significant downregulation of PDE9A in b Colorectal Adenoma (COA), c Rectal Mucinous Adenocarcinoma (REMAD), d Cecum Adenocarcinoma (CEAD), e Rectal Adenocarcinoma (READ), f Colon Mucinous Adenocarcinoma (COMAD), g Colon Adenocarcinoma (COAD), h Colon Adenoma (COA), i Colon Carcinoma (COCA), j Colon Adenoma (COA), k Colorectal Carcinoma, l Rectal Adenocarcinoma (READ), m Colorectal Carcinoma

