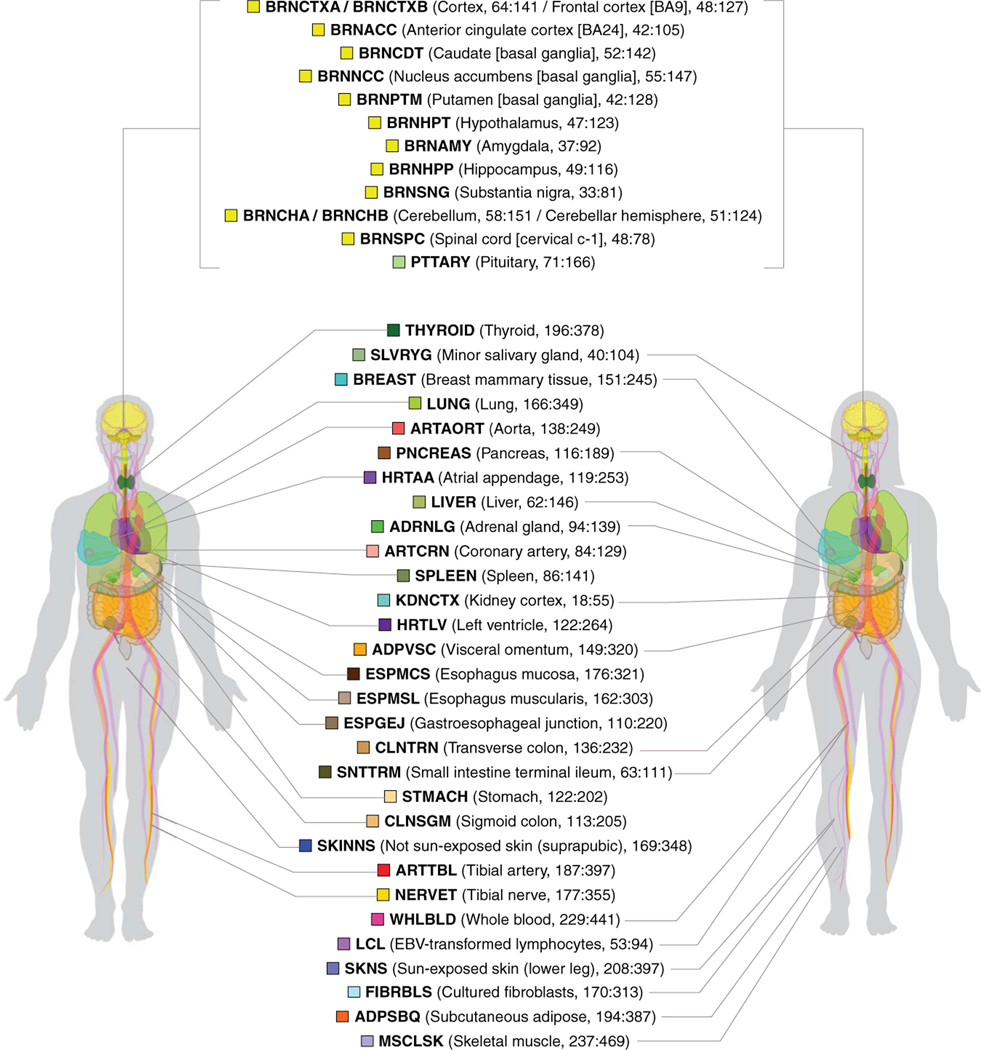
Fig. 1. Sample, data types, and discovery sets in the study of sex differences in GTEx v8.
Tissue types (including 11 distinct brain regions and two cell lines) are illustrated, with sample numbers from GTEx v8 genotyped donors (females:males, in parentheses) and color coding indicated for each. This study included N = 44 tissue sources present in both sexes with ≥70 samples. Tissue sources comprised two cell lines, 40 tissues, and two additional replicates for brain cerebellum and cortex tissues. Tissue name abbreviations are shown in bold. See (9) for specific numbers of donors used in each analysis.

