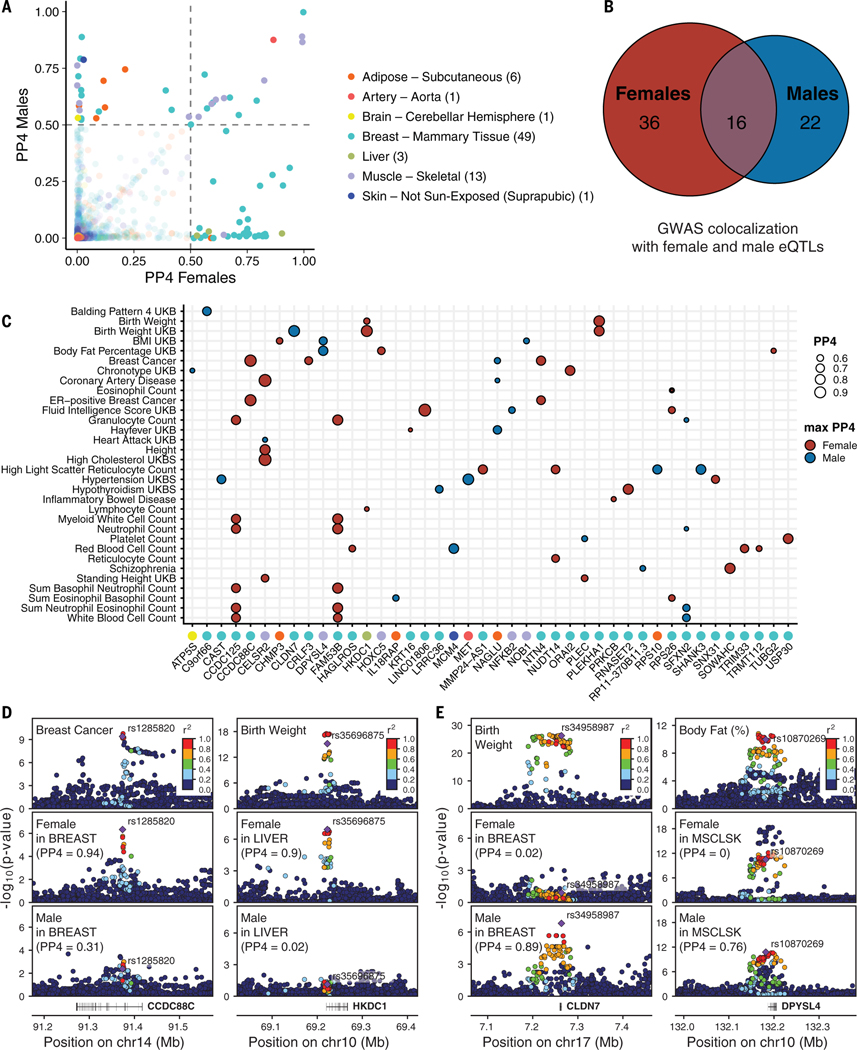
Fig. 5. Colocalization of sb-eQTLs with GWAS traits.
(A) Posterior probability (PP4) of 74 colocalized gene-trait pairs where a GWAS shows evidence of colocalization with the female-stratified and/or male-stratified cis-eQTL signal (PP4 > 0.5). Numbers of colocalizing loci per tissue are shown in parentheses. (B) Numbers of colocalizing loci for female and male cis-eQTLs. (C) GWAS-eQTL colocalizing genes (PP4 > 0.5) color-labeled by eQTL tissue of origin according to labels in (A) (x axis) are categorized by the sex where the colocalization signal is maximized with the corresponding GWAS trait (y axis). Comparing the colocalization PP4 values for male and female cis-eQTL signals, the estimates can be maximum in females (red) or males (blue). (D) Genotype-phenotype association P values of the CCDC88C (left) and HKDC1 (right) loci. For the CCDC88C locus, panels illustrate GWAS signal for breast cancer (top) and CCDC88C cis-eQTL signal for females (middle) and males (bottom) in breast mammary tissue. For the HKDC1 locus, panels illustrate GWAS signal for birth weight (top) and HKDC1 cis-eQTL signal for females (middle) and males (bottom) in liver. (E) Genotype-phenotype association P values of the CLDN7 (left) and DPYSL4 (right) loci. For the CLDN7 locus, panels illustrate GWAS signal for birth weight (top) and CLDN7 cis-eQTL signal for females (middle) and males (bottom) in breast mammary tissue. For the DPYSL4 locus, panels illustrate GWAS signal for body fat (top) and DPYSL4 cis-eQTL signal for females (middle) and males (bottom) in muscle skeletal tissue. In (D) and (E), linkage disequilibrium between loci is quantified by squared Pearson coefficient of correlation (r2). Diamond-shaped point represents the top significant cis-eQTL variant across sex-stratified P values.

