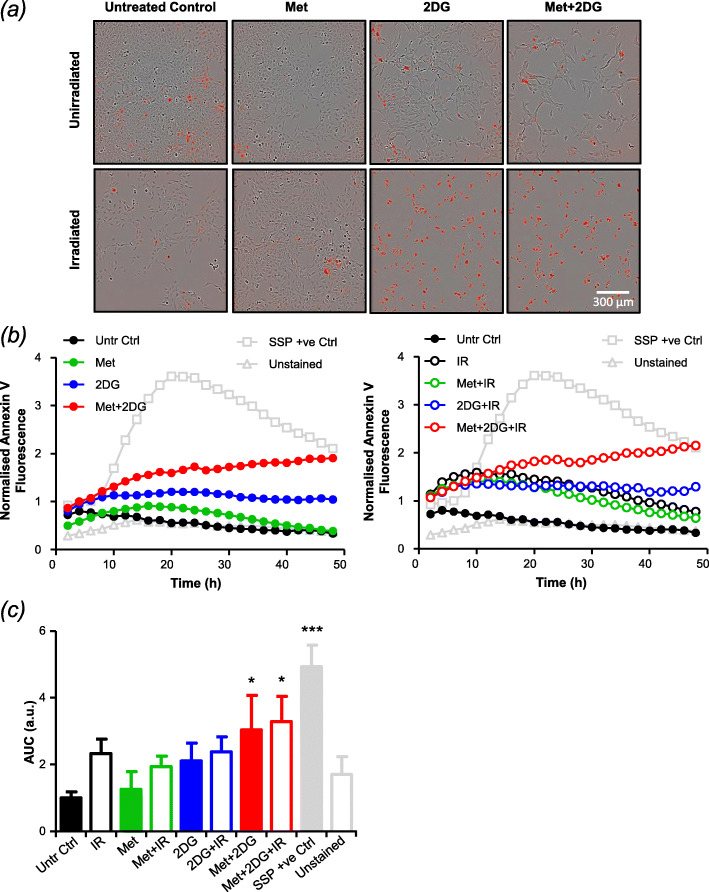
Fig. 6.
The effect of combination treatment on apoptotic frequency. UVW/NAT cells were treated with 2 Gy X-radiation (administered at the start of treatment), 1 mM metformin, or 1 mM 2DG as single agents or in combination for 48 h and were imaged every hour using the IncuCyte Zoom imaging system. Representative images taken after 48h treatment exposure are shown (a). Apoptotic frequency was determined following Annexin V staining. Annexin V-positive cells (displaying red fluorescence) were normalised to the total number of cells present (b) and the area under the curve (AUC) was calculated (c) to allow comparisons between each condition and the treatment controls (untreated control (Untr Ctrl), unstained negative control (unstained) and staurosporine positive control (SSP +ve)). Data are means ± SEM from 3 separate experiments, each performed in sextuplet wells. *p < 0.05, **p < 0.01 compared to untreated control cells (one-way ANOVA)

