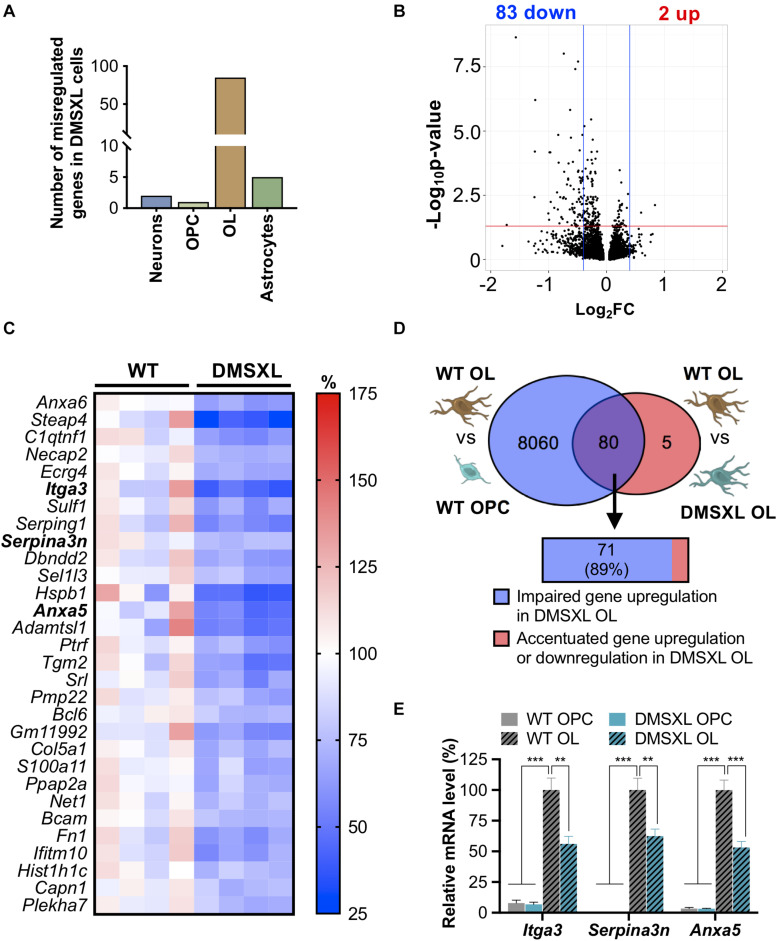
FIGURE 3.
Expression changes in DMSXL brain cells and impaired upregulation of gene expression in oligodendroglia. (A) Number of genes differentially expressed in each DMSXL brain cell type. Inclusion criteria: absolute fold change > 1.4; p (corrected for multiple comparisons) < 0.05. Total number of gene transcripts identified: neurons, 17,089; OPC, 15,845; OL, 16,070; Astrocytes, 16,878. (B) Volcano plot representing the dysregulated transcripts in DMSXL OL, showing that most of the expression defects resulted in gene downregulation, when compared to WT controls. (C) Heatmap representing the expression changes of the 30 most significantly affected genes in DMSXL OL, relative to normalized expression in WT OL. Inclusion criteria: absolute fold-change > 1.4, p (corrected for multiple comparisons) < 0.001, and base-mean expression value > 50. Genes highlighted in bold were validated by RT-qPCR. (D) Overlap of the 85 expression changes in DMSXL OL with the variations that accompany WT oligodendroglia differentiation in culture (representation factor: 2.4, p < 1.9E-27). The majority of the overlapping genes failed to upregulate their expression to match the levels of WT OL (Fisher’s exact test, p < 0.001). (E) RT-qPCR quantification of Itga3, Serpina3n, and Anxa5 transcripts in DMSXL OL, confirming lower total expression relative to WT cells after differentiation in culture (**p < 0.01; ***p < 0.001; one-way ANOVA; n = 3 OPC; n = 6 OL independent cultures per genotype).

