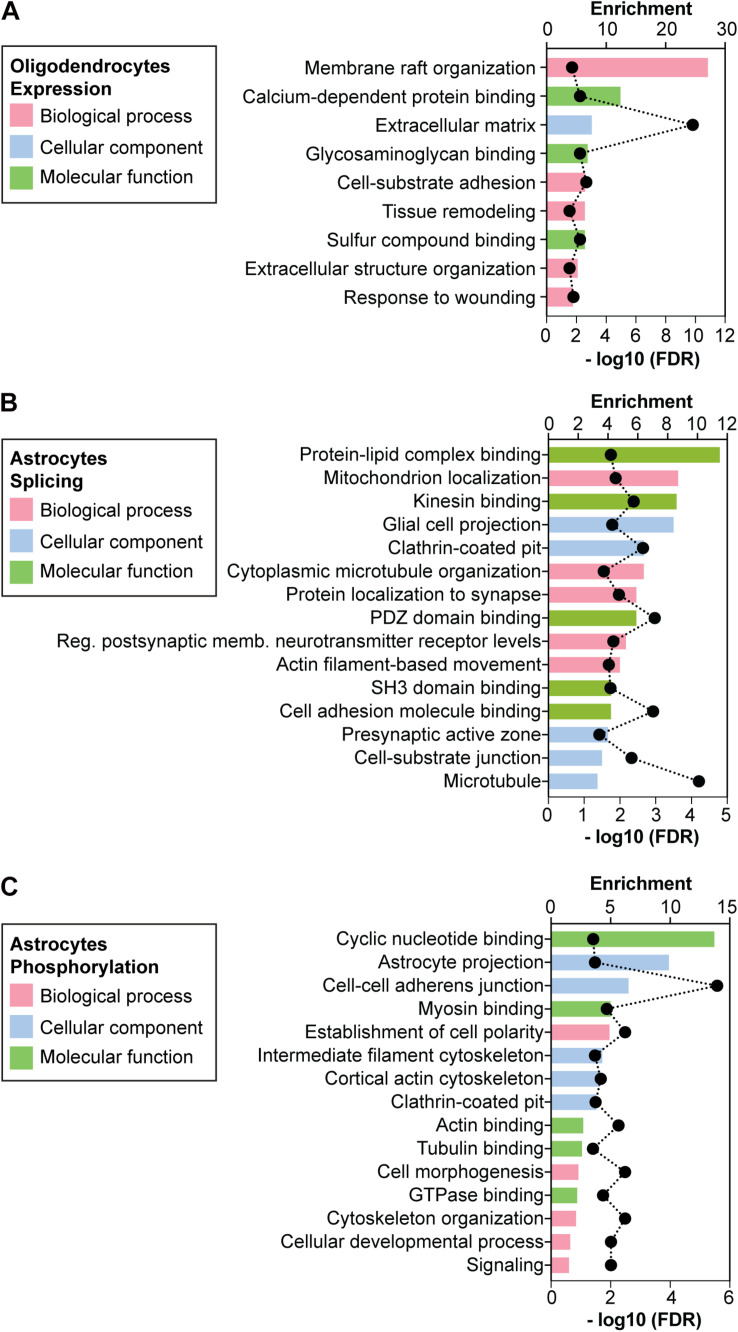
FIGURE 4.
Gene ontology of expression, splicing and phosphorylation changes detected in primary DMSXL cells. Enriched non-redundant GO terms associated with the genes showing (A) altered expression levels in primary DMSXL OL, (B) variations in alternative splicing in primary DMSXL astrocytes, and (C) changes in protein phosphorylation in primary DMSXL astrocytes. The graphs represent the enrichment ratio and the -log10(FDR) of enrichment. A maximum of 5 terms are presented for each ontology (biological process, cellular component and molecular function).

