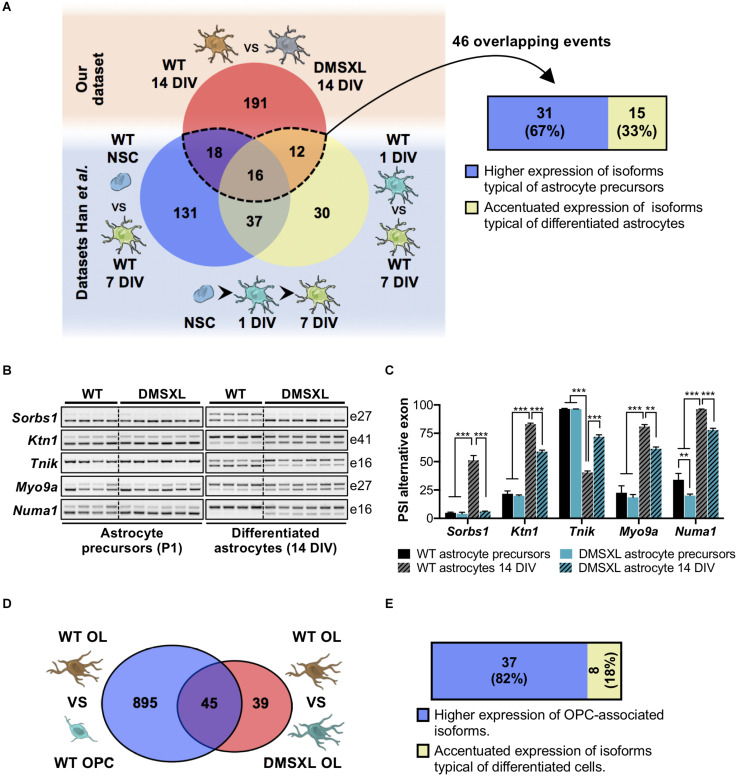
FIGURE 6.
Analysis of DMSXL splicing profiles during glia cell differentiation. (A) Significant overlap of DMSXL astrocytes splicing defects with changes occurring during WT astroglia differentiation (representation factor: 23.4, p < 1.7E-49). A significant fraction of overlapping splicing changes resulted in the upregulation of RNA isoforms typical of less differentiated astrocytes (Fisher’s exact test, p = 0.023). (B) RT-PCR analysis of alternative cassette exons with impaired or partial splicing switch during astrocyte differentiation, from isolated precursors (P1) to astrocytes differentiated in culture (14 DIV). Alternative exon numbers are indicated on the right. (C) PSI of alternative exons in astrocyte precursor and astrocytes differentiated in culture (14 DIV), collected from DMSXL and WT mice (**p < 0.01; ***p < 0.001; one-way ANOVA; n = 4 WT, n = 6 DMSXL, independent cultures). (D) Overlap of splicing variations concomitant to WT oligodendroglia transition, with the dysregulated splicing events in DMSXL OL (representation factor: 16.5, p < 1.4E-44). (E) Significant overrepresentation of splicing changes that increase the expression of OPC-associated RNA isoforms in DMSXL OL (Fisher’s exact test, p = 0.003). Drawings of brain cells from Servier Medical Art, licensed under a Creative Commons Attribution 3.0 Unported License (CC BY 3.0).

