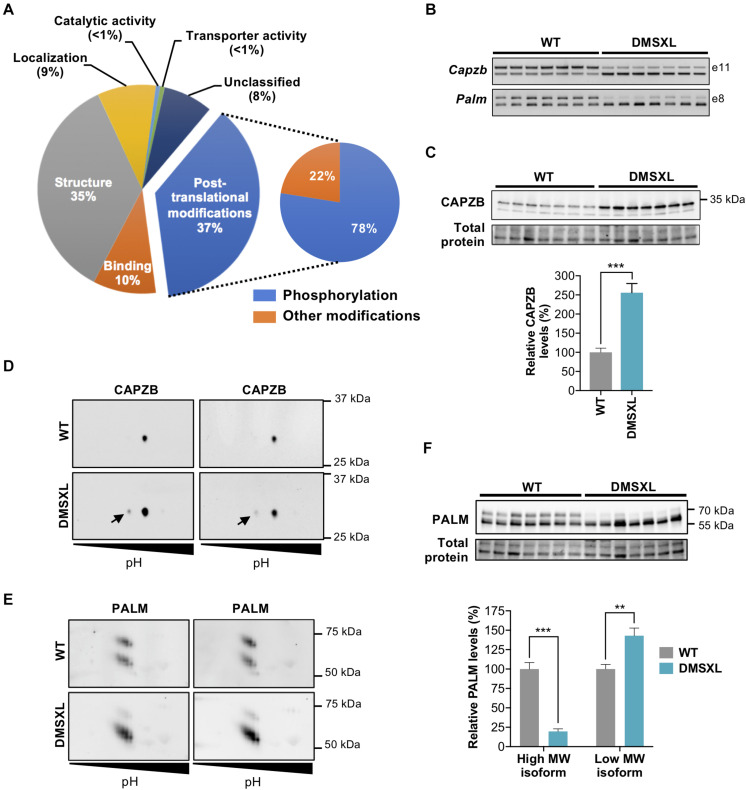
FIGURE 7.
Exon ontology analysis and phosphoproteomic analysis of DMSXL astrocytes. (A) Exon ontology analysis shows the impact of splicing changes on several features of proteins of primary DMSXL astrocytes. (B) Representative RT-PCR analysis of alternative splicing of Capzb exon 11 and Palm exon 8 in primary mouse astrocytes, showing pronounced missplicing in DMSXL cells (n = 7 independent cultures, per genotype). (C) Western blot analysis of CAPZB, showing upregulation of C-terminal protein isoform in DMSXL astrocytes (***p < 0.001; Student t-test; n = 7 per group). (D) 2D-WB phosphorylation analysis of CAPZB, showing the expression of a phosphorylated form (arrow) in DMSXL astrocytes (n = 2 independent cultures, per genotype). (E) Two-dimension western blot of PALM showing abnormal protein isoform between genotypes, revealing low levels of a high molecular weight isoform in DMSXL astrocytes (n = 2 independent cultures, per genotype). (F) Western blot quantification showing the changes in the relative abundance of PALM protein isoforms: downregulation of the high molecular weight isoform, and upregulation of low molecular weight isoform (**p < 0.01; ***p < 0.001; Mann Whitney U test; n = 7 independent cultures per genotype).

