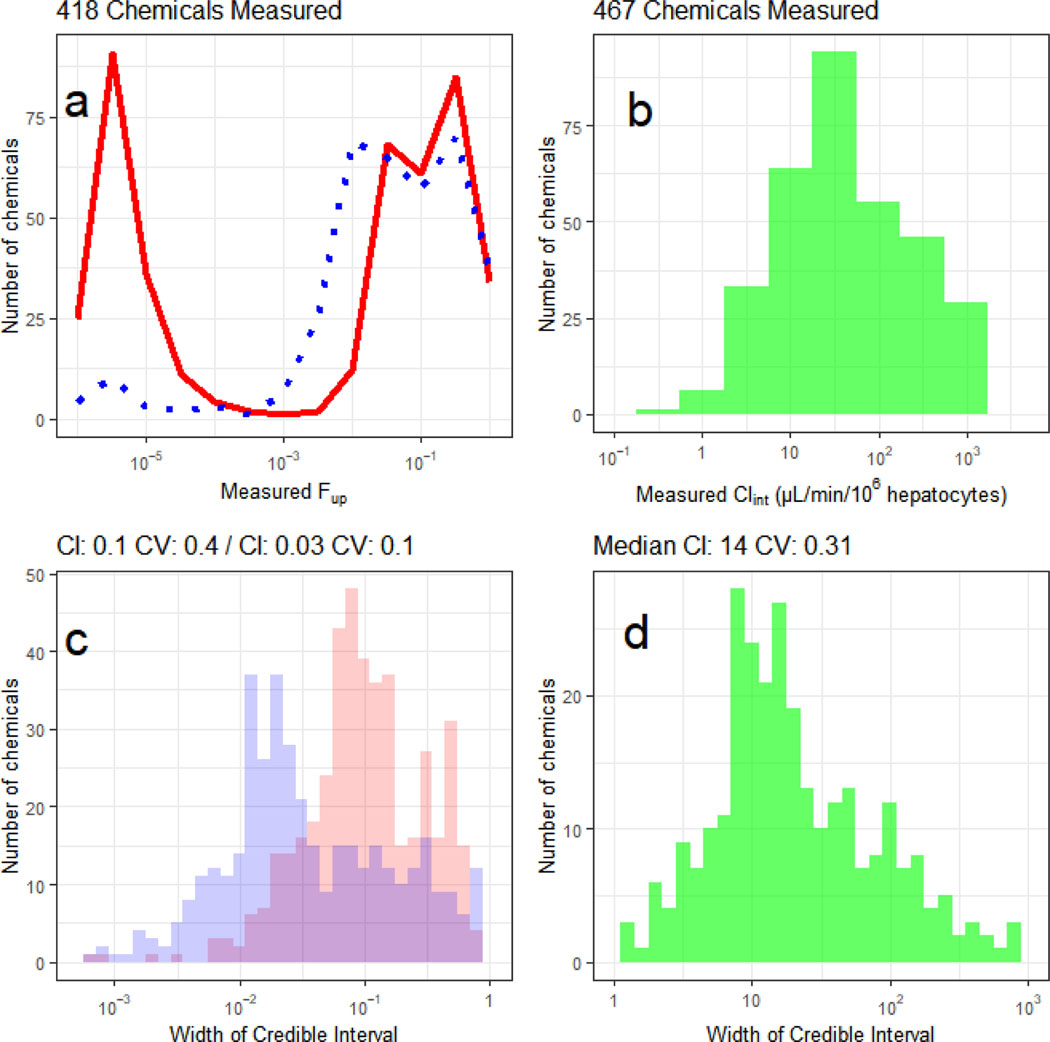
Figure 1:
Histograms depicting the median measured values (a, b) and 95% credible intervals (c, d) for fraction unbound in plasma (fup, a,c) and intrinsic hepatic clearance (Clint, b,d). In panel a, the distribution of estimated fup for the single protein concentration assay (solid line) is compared with the protein titration (three concentrations) method (dotted) line. In panel b, the median estimated Clint is shown. In panel c, the distribution with larger credible intervals corresponds to the single protein concentration assay, with a median credible interval is 0.1, corresponding to a precision of roughly ±0.05. When data from the protein titration are jointly analyzed (smaller credible intervals), the certainty is increased to a median credible interval of 0.029, or roughly ±0.015. The width of the credible interval is a measure of the certainty in an estimate, i.e., a smaller credible interval indicates greater certainty. For the fup values, a credible interval approaching 1 indicates that all possible values are consistent with the data – that is, the data do not help identify fup since fup must be between 0 and 1. In panel d the distribution of credible intervals for Clint is shown.

