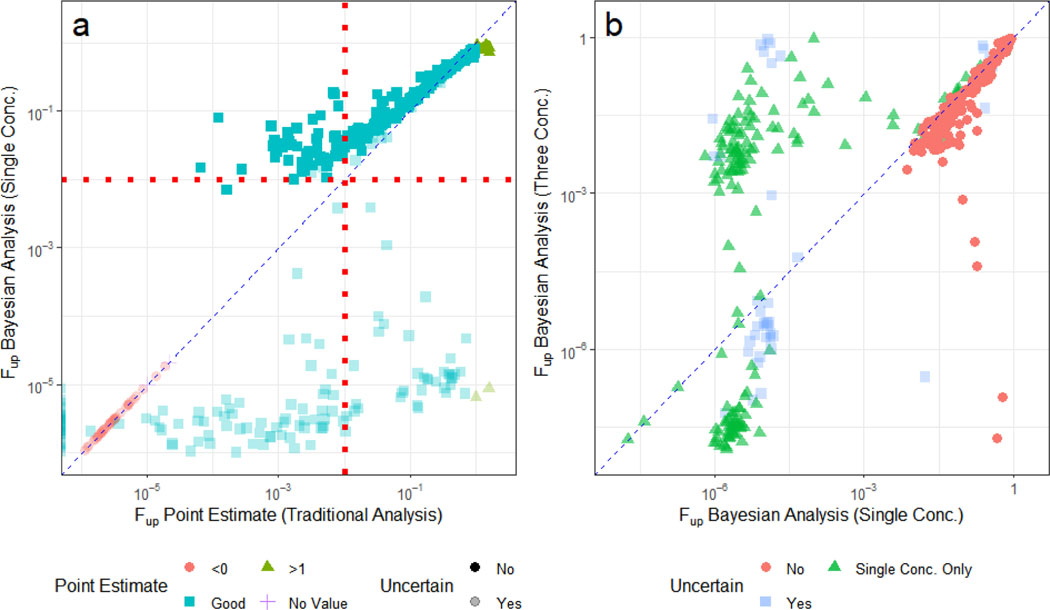
Figure 3.
Comparison of Bayesian fup and Uncertainty Estimations to Experimental Point Estimates. Two separate Bayesian analyses were performed: one including only those data collected at 100% PPP, and a second that used a binding model to relate data collected at 10%, 30%, and 100% PPP. In (A), fup point estimates <0 are plotted on the y-axis. These values are considered “good” if they lie between 0 and 1. The Bayesian median fup values (x-axis) derived from the 100% PPP data and the associated uncertainty estimates (vertical lines) were correlated with point estimates. Bayesian model estimates were constrained to be greater than zero and less than 1;. The red dotted line (at 1%) represents a previously assumed generic limit of quantification (Wetmore, et al., 2015; Wetmore, et al., 2012). In (B), the medians from the two Bayesian analyses are compared. In both plots, the diagonal dashed line indicates the identity line (“perfect predictions”). In both panels the Bayesian estimates are “uncertain” (semi-solid) if the CV was larger than 0.5 and certain (solid) otherwise.

